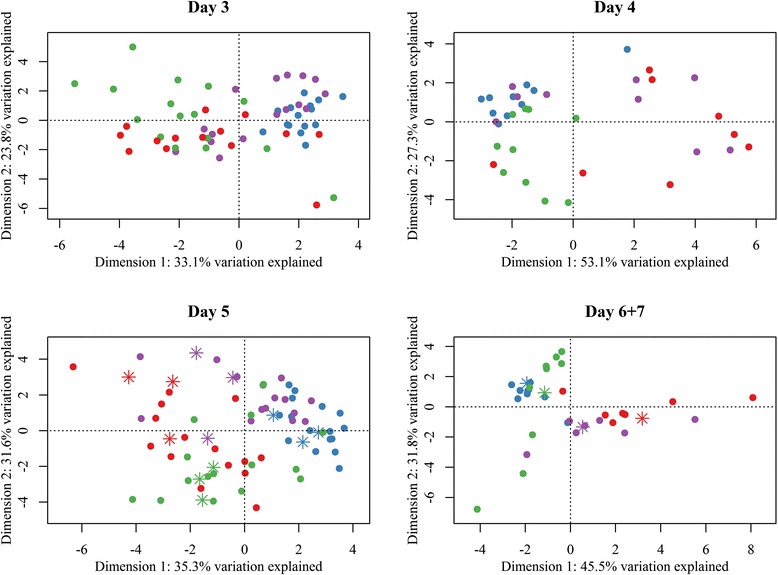
Figure 3.

PCA score plot of the gut microbiota segregated on gut section according to age in days. PCA scores from normalized relative values of ileal and colonic content of case and control piglets in relation to age in days obtained from the Gut Microbiotassay. Blue: Control colon, Purple: Case colon, Green: Control ileum, Red: Case ileum. Asterisks symbolize samples selected for 454 sequencing. Samples cluster primarily according to diarrhoeic status with increasing age. For further information see Additional files 2 and 4.
