
Fig. 2.
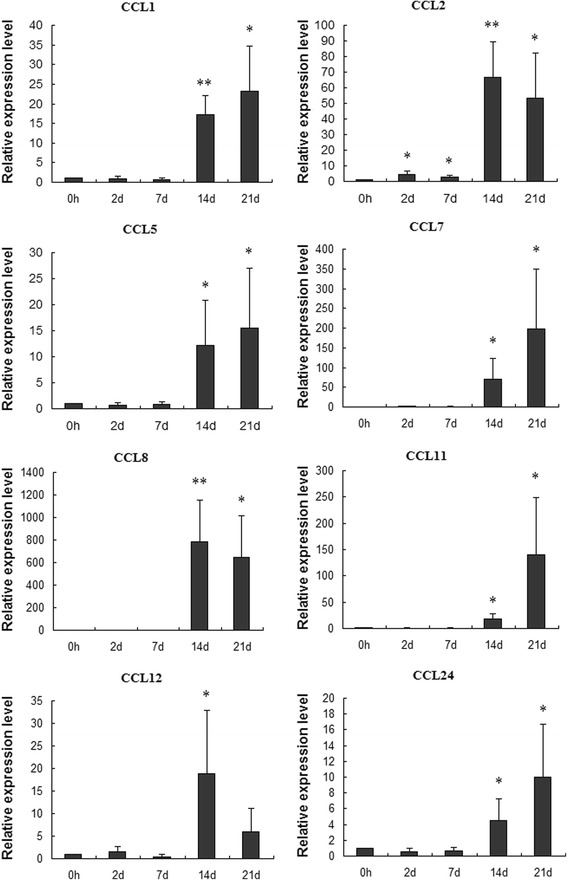
Differential expression of CC chemokines validated by Q RT-PCR. The relative expression level was calculated with the equation 2-ΔΔCt and the error bars represented the standard error (n = 5). * represents p < 0.05, and **represents p < 0.01 compared with control group