
Fig. 2 .
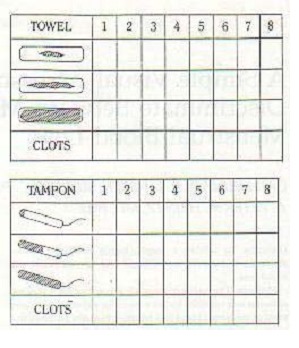
The pictorial blood loss chart. The numbers 1-8 represent the consecutive days of a bleeding episode, the columns could be added to the chart if needed.
Official websites use .gov
A
.gov website belongs to an official
government organization in the United States.
Secure .gov websites use HTTPS
A lock (
) or https:// means you've safely
connected to the .gov website. Share sensitive
information only on official, secure websites.
The pictorial blood loss chart. The numbers 1-8 represent the consecutive days of a bleeding episode, the columns could be added to the chart if needed.