Fig. 1.

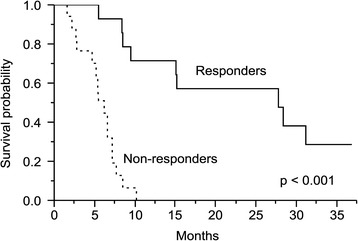
Overall survival rates according to the response of tumor. Responders had significantly better survival than non-responders (p < 0.001)

Overall survival rates according to the response of tumor. Responders had significantly better survival than non-responders (p < 0.001)