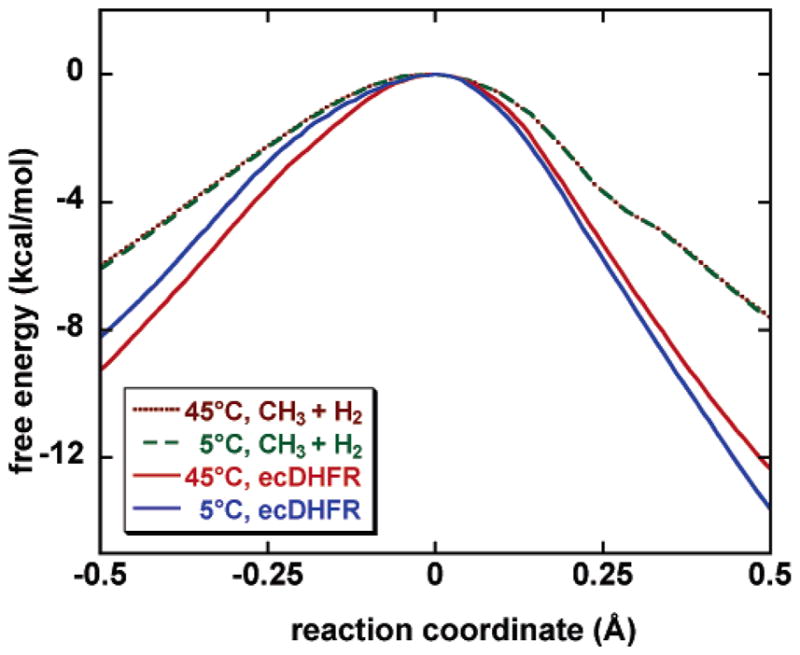
Figure 5.

Computed free-energy profiles (with quantized vibration contributions included) along the reaction coordinate for the ecDHFR catalyzed reaction at 5 and 45 °C. The same profiles for the gas-phase hydrogen transfer reaction of CH3 + H2 are shown for comparison, where the reaction coordinate is distance along the mass-scaled minimum-energy path (scaled to mass of 1 amu). All curves have been normalized at the top to emphasize the difference in the barrier shape as temperature changes.
