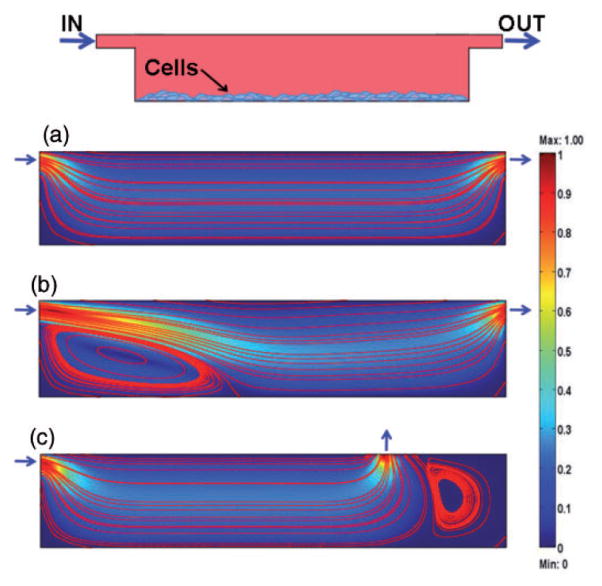
Figure 1.
Mathematical modeling of flow profiles. A model microwell was designed and different flow regimes and geometries of the inlets and outlets were tested for the cells adhering to the bottom surface (numerical simulations by Comsol Multiphysics). The heat map represents the dimensionless velocity of fluids with respect to the inflow velocity. Streamlines allow visualization of the patterns followed by fluids. (a) Perfectly laminar and orderly flow with low levels of shear stress experienced by the cells generated at low flow velocities. (b) Higher velocities lead to increases in shear stress and the formation of stagnant areas within the culture chamber. (c) Poorly positioned inlets and outlets result in the formation of stagnant areas even at the proper flow rates. (A color version of this figure is available in the online journal.)

