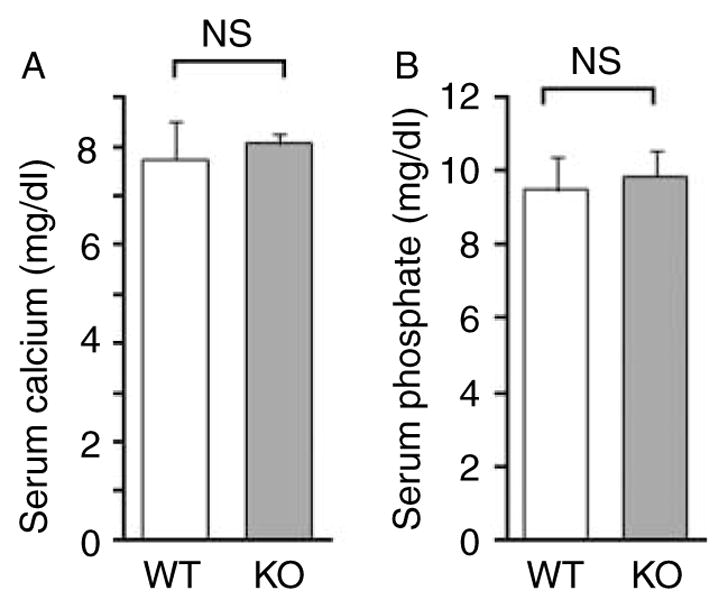
Figure 4.

Serum concentrations of calcium and inorganic phosphate. Values of calcium concentrations (A) and inorganic phosphate concentrations (B) are shown. No statistically significant difference was found between wild-type (WT; n=4) and PXR knockout (KO; n=4) mice.
