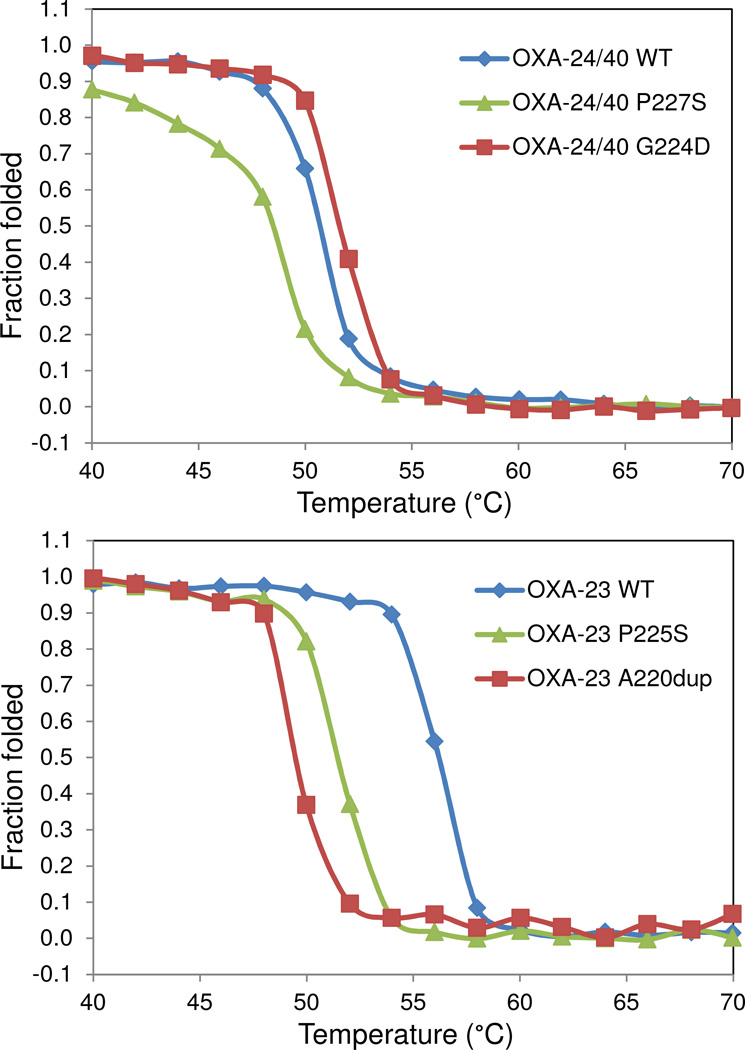
Figure 7. Thermal denaturation curves for OXA-23, OXA-24/40 and several of their variants.
Unfolding was monitored by slowly raising the temperature of each protein solution and monitoring by circular dichroism. The P→S variant lowered the melting temperature in both the OXA-24/40 background (top panel) and the OXA-23 background (lower panel).

