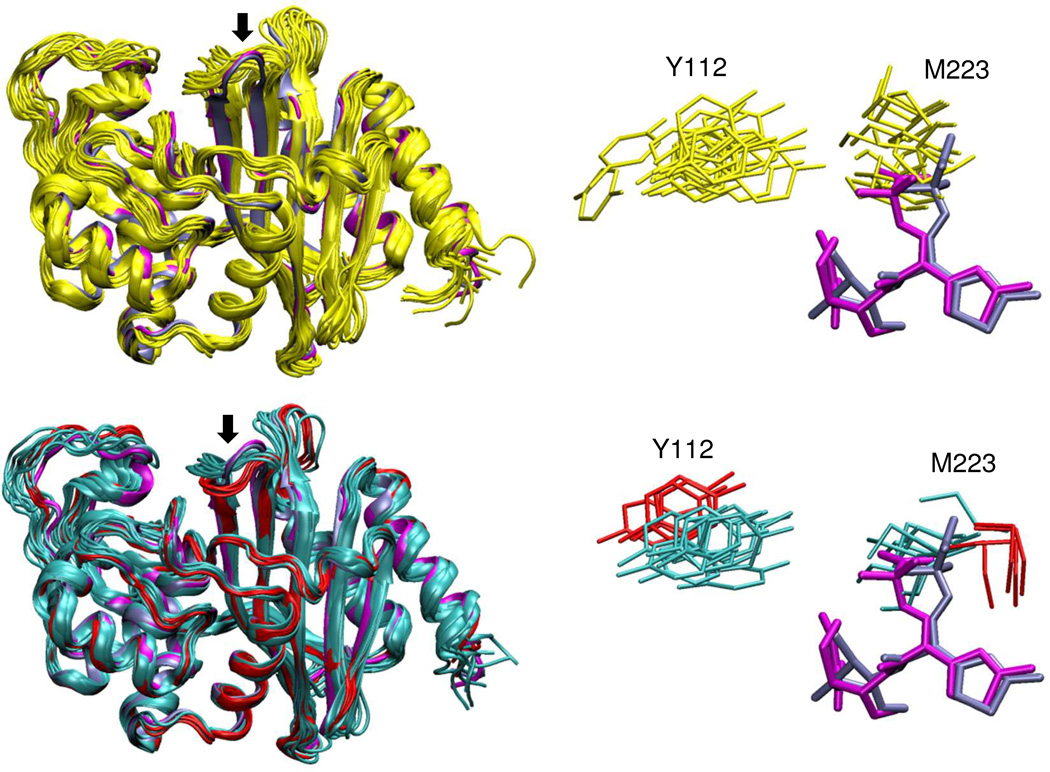
Figure 9. Comparison of conformational diversity in OXA-160 and OXA-24/40.
Left panels: representative conformers observed in molecular dynamics simulations for OXA-24/40 (yellow) and OXA-160 (two clusters shown in cyan and red). The two OXA-160 structures from this study (PDB 4X53 and 4X56, blue and magenta respectively) are included in the alignment (ligands not shown). The β5-β6 loop is marked with an arrow in both structures. Right panels: Side-chains for the bridge residues Y112 and M223 from the same representative structures. Also shown are ceftazidime (magenta) and aztreonam (blue) from the two OXA-160 X-ray structures after alignment of those structures with the simulation conformers.

