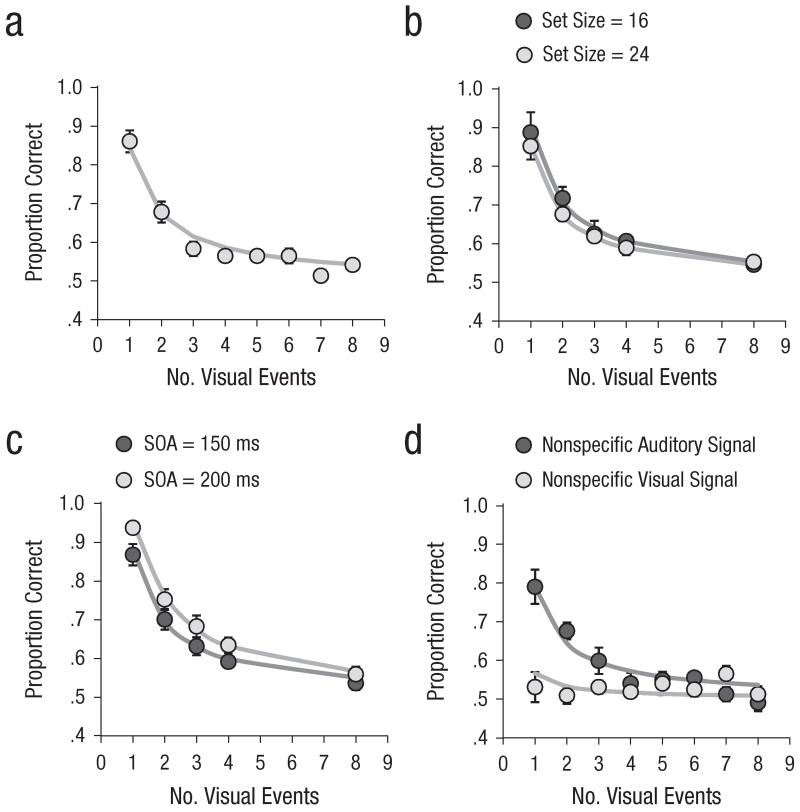
Fig. 3.
Results of Experiment 1: mean proportion correct (circles) and model fit (solid lines) as a function of number of visual events in (a) Experiment 1a, (b) Experiment 1b, (c) Experiment 1c, and (d) Experiment 1d. Results are shown separately for the two set sizes in Experiment 1b, the two stimulus onset asynchronies (SOAs) in Experiment 1c, and the two cue modalities in Experiment 1d. The error bars represent the overall standard errors of individuals’ mean proportion correct (some error bars are too small to be visible here).

