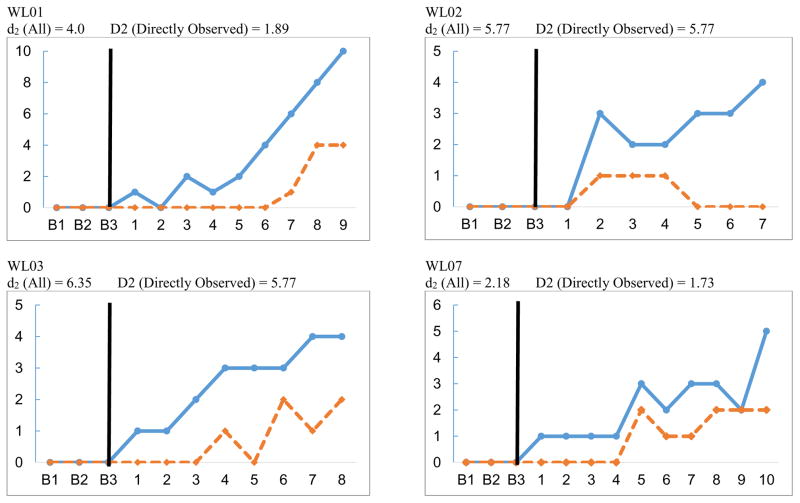
Figure 1.
Participant learning on target and control words across session pairs.
Notes: The x-axis represents baseline sessions and, after the black line, session pairs. The y-axis represents number of words to be learned. The solid lines represent target words produced, and the dashed lines represent control words produced. These lines represent productions from probe, in treatment, or home reporting. All = all possible productions (probe, in treatment, and home). Directly Observed = productions directly observed by clinicians (probes and in treatment).

