
Figure 3. JMJD3 expression in MDS BM CD34+ cells.
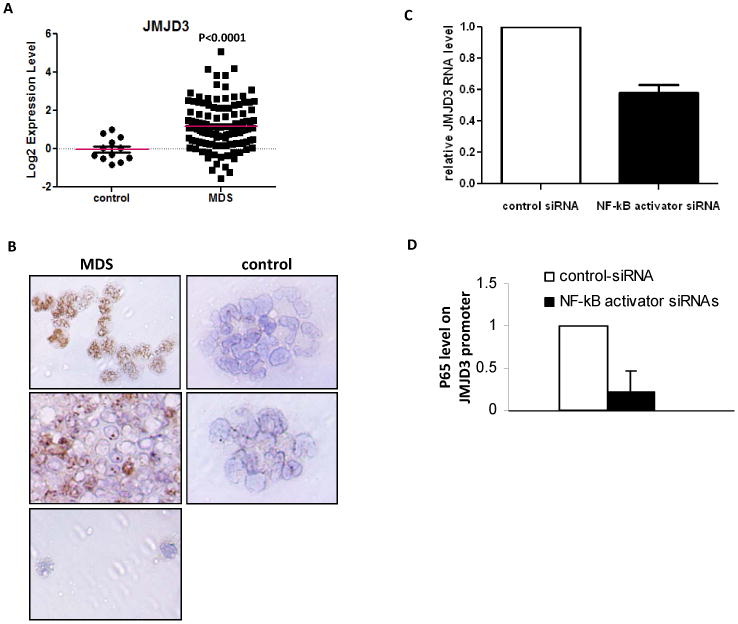
(a) Logarithmic representation of JMJD3 Q-RTPCR results in MDS and control CD34+ cells in 121 MDS CD34+ samples. (b) Immuno-histochemical analysis of JMJD3 in cytospins of MDS (Left 3 panels: Top 2 with strong JMJD3 staining and Bottom 1 with weak JMJD3 staining) and controls (Right 2 panels: both with weak JMJD3 staining) bone marrow CD34+ cells. (c) Q-RTPCR analysis of JMJD3 RNA expression in OCI-AML3 cells transfected with siRNAs targeting C5AR1, FPR2, TYROBP and PTAFR or controls. (d) p65 CHIP-PCR analysis of JMJD3 promoter in the OCI-AML3 cells transfected with the siRNAs targeting C5AR1, FPR2, TYROBP and PTAFR or controls.