
Figure 5. Effect of JMJD3 shRNA transduction in cultured MDS bone marrow CD34+ cells.
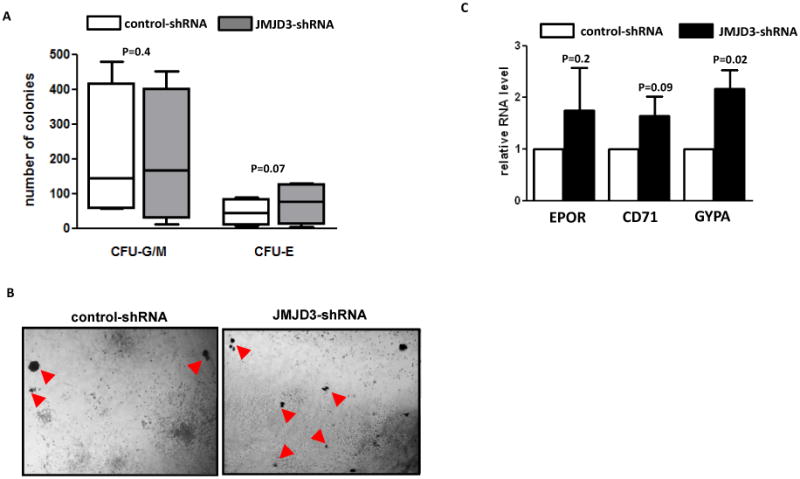
(a) Numbers of myeloid colonies (CFU-G/M) and erythroid colonies (CFU-E) formed in methocult culture two weeks after transduction of JMJD3-shRNA and control shRNA in BM CD34+ cells isolated from patients with lower-risk MDS (low-risk and intermediate-1). (b) Representative microphotographs of colonies formed in methocult plates after transduction of control shRNA (Left panel) and JMJD3-shRNA (Right panel). Red arrows point to CFU-E. (c) Q-RTPCR analysis of the RNA levels of CD71, EPOR and GYPA in cells collected from total colonies after shRNA transduction and methocult assays.