Fig. 4.

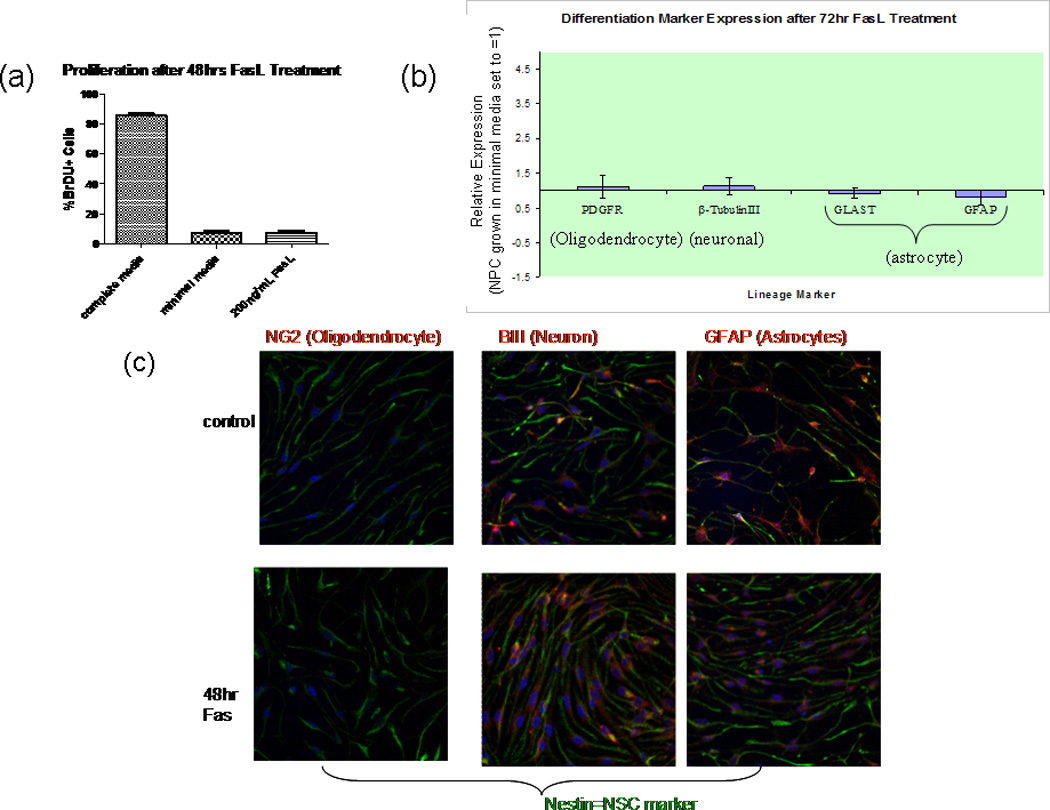
Fas activation does not influence NPC differentiation or proliferation. a: Cells treated with 200 ng/ml FasL were fixed, and proliferation was subsequently assesed using BrDU assay. No significant difference was detected between FasL-treated cells and controls (minimal media). Results include proliferation of cells in complete media (with growth factors) for comparison. Percentage of BrDU-positive cells was determined by comparing with total number of cells (stained with Hoescht nuclear dye). Random fields were counted at 20× in Neurolucida Steroinvestigator software; n = 4 (No. of slides per condition). b: RNA extracted from NPC treated for 72 hr with FasL in minimal media was subjected to cDNA reverse transcription, and the resulting cDNA was analyzed by using RT-qPCR. NPC cDNA were normalized against βactin (endogenous control marker) and subsequently expressed as -fold differences relative to NPC grown in minimal media. Specific primer pairs for β-tubulin III, platelet-derived growth factor receptor (PDGFR)-α, glial fibrillary acidic protein GFAP), and astrocyte-specific glutamate transporter (GLAST) were utilized to determine mRNA expression. The 2−ΔΔCt method was used to calculate the relative expression of genes. FasL treatment had no effect on oligodendrocyte (PDGFR), neuronal (β- tubulin III), or astrocyte GLAST and GFAP) lineage differentiation. Data represent the mean from five different cultures ±SEM (n = 4, P > 0.05). c: Cells were grown to confluence on poly-D-lysine- and laminin-coated coverslips. Spontaneous differentiation, upon withdrawal of growth factors for 48 hr (top), was compared with 48 hr FasL-treated cells (bottom). Cells were fixed with Zamboni’s fixative and then costained with anti-mouse nestin (chicken) and NG2, β - tubulin III, or GFAP (all rabbit anti-mouse) primary antibodies. All coverslips were then stained with both anti-chicken Cy2 and anti- rabbit Cy3 secondary antibodies. Mounted slides were visualized with a Nikon Eclipse E800 fluorescent microscope, and photos were taken with Photometrics CoolSNAP cf software. No significant difference in any lineage marker was observed upon FasL treatment (n = 3).
