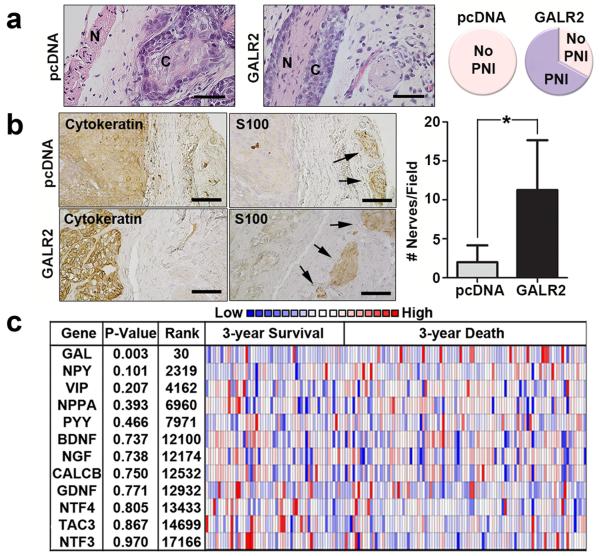
Figure 1. GAL correlates with poor survival and neuronal involvement.
(a) Murine tumours derived from OSCC3-GALR2 cells but not control (OSCC3-pcDNA) cells, exhibit PNI (n = 3 per group, scale bar = 100 μm) (N = nerve; C = cancer). The complete image is in Supplementary Fig. 1b. Comparison of PNI to no PNI in control and GALR2 overexpressing murine xenografts (right panel). (b) GALR2-expressing murine tumours had more adjacent nerves than control tumours (n = 3 per group, arrows identify nerves, scale bar = 50 μm). (*P < 0.05, two sample t-test; data represent mean + SD). Cytokeratin labels tumour and S100 labels nerves. GAL staining distal and proximal to the nerve is shown. (c) The Cancer Genome Atlas (TCGA) study shows that, of several neuronal proteins, only GAL DNA copy number significantly correlates with poor survival (two sample t-test, P = 0.003, 30th most significant).

