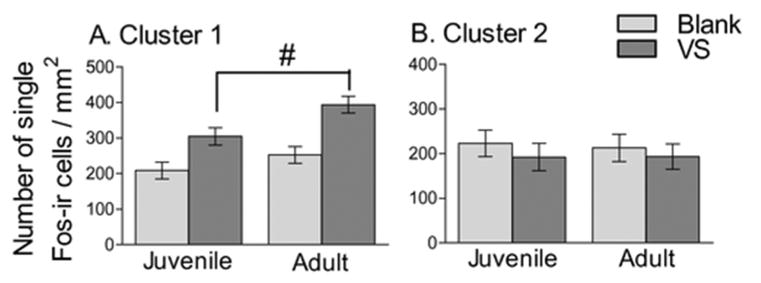
Figure 3.

Fos-ir cell density in mesocorticolimbic (A) and hypothalamic (B) clusters. There was a greater density of Fos-ir cell in VS exposed hamsters compared to blank hamsters in the mesocorticolimbic but not hypothalamic clusters. # indicates a main effect of swab, p < 0.01 with multilevel modeling analysis.
