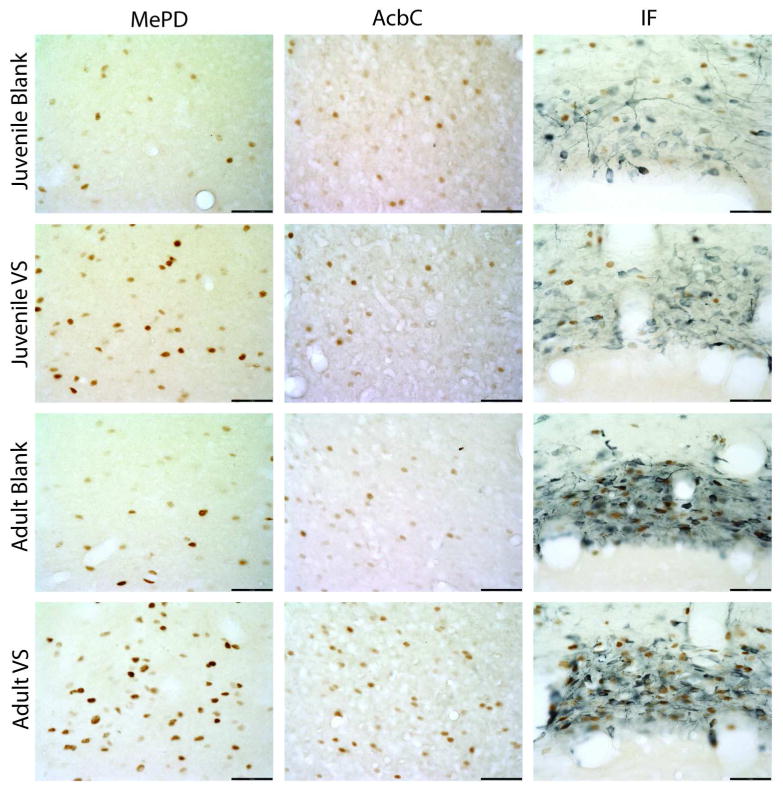
Figure 4.

High magnification photomicrographs of representative Fos- (brown nuclei) and TH- (blue cytoplasm) immunoreactive tissue sections from juvenile and adult animals exposed either blank or VS swabs in the AcbC, MePD, and IF. Scale bar is 50μm.
