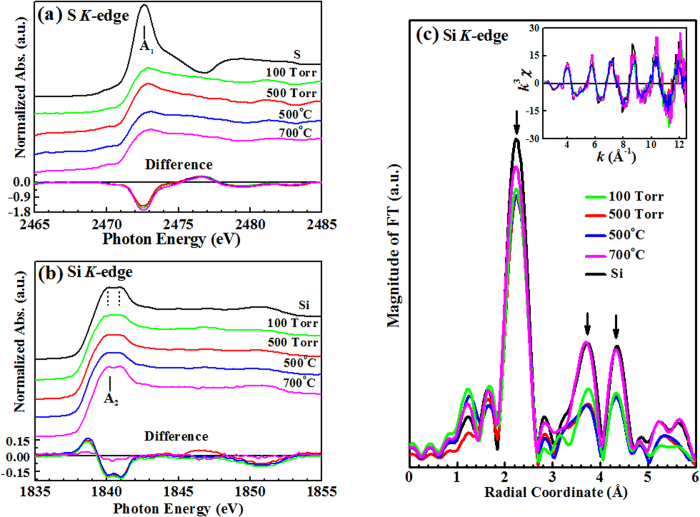
Figure 3.
(a) S K-edge XANES of hyperdoped Si samples and pure S as a reference. Bottom panel shows the difference spectra of hyperdoped Si samples and reference pure S. (b) Si K-edge XANES of hyperdoped Si samples and reference undoped Si(100). Bottom panel shows the difference spectra of hyperdoped Si samples and reference Si(100). (c) FT of Si K-edge EXAFS spectra of hyperdoped Si samples for k between 2.3 and 12.5 Å−1. Inset plots EXAFS k3χ data.

