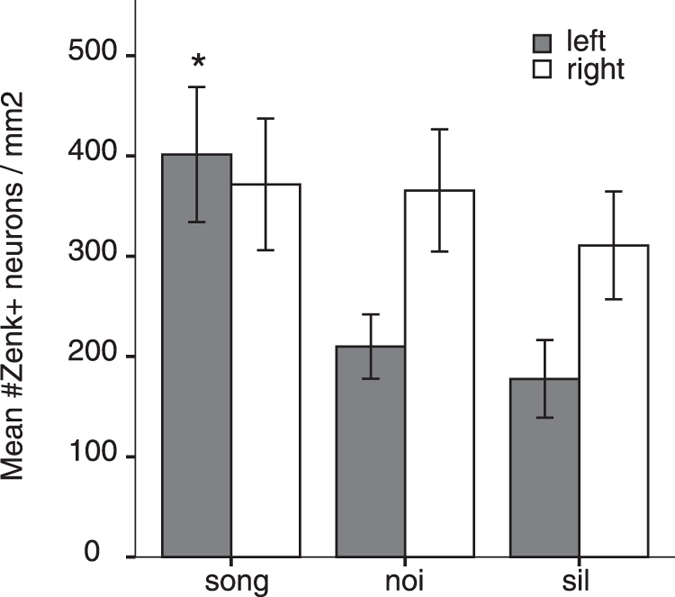
Figure 3. Zenk expression in the left and right NCM of juvenile zebra finches.

Mean number of Zenk-immunopositive neurons per square millimeter in the NCM is shown for the left (grey) and right (white) hemisphere. The mean activation level is higher in the NCM of zebra finches that were exposed to tutor song than to noise or silence, in the left hemisphere only (indicated with asterisk, see Results for statistics). Error bars represent the SEM.
