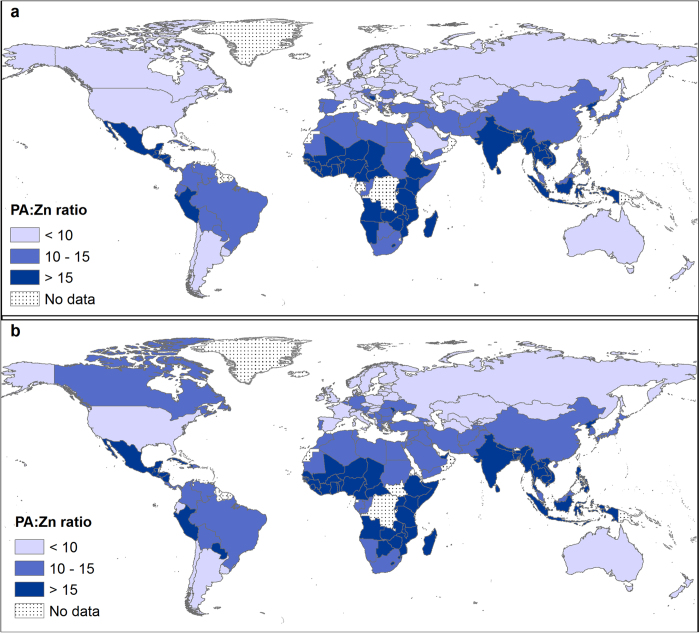
Figure 5.
Phytate:Zn (PA:Zn) molar ratio in 1992 (a) and 2011 (b), based on per capita PA and Zn supplies. Country boundaries were downloaded from the GADM Global Administrative Areas database (http://gadm.org/, Version 2, January 2012). Thematic mapping of PA:Zn ratio was carried out in ArcGIS 10.2.1.

