Figure 1.

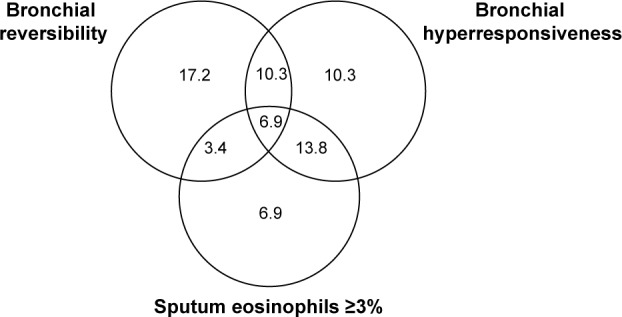
Venn-diagram showing the percentage distribution of bronchial reversibility, bronchial hyperresponsiveness, and sputum eosinophilia in the COPD subjects enrolled in the study.

Venn-diagram showing the percentage distribution of bronchial reversibility, bronchial hyperresponsiveness, and sputum eosinophilia in the COPD subjects enrolled in the study.