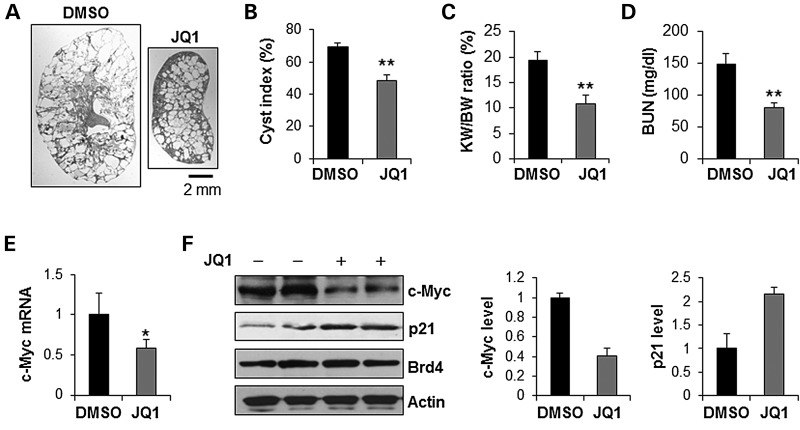
Figure 6.
Treatment with JQ1 delayed cyst growth in Pkd1flox/flox:Pkhd1-Cre mice. (A) Gross and histologic examination of PN25 kidneys from Pkd1flox/flox:Pkhd1-Cre neonates treated with vehicle (DMSO) (n = 7) or JQ1 (n = 7), respectively. Scale bar, 2 mm. (B) Quantification of the percentage of cystic areas over total kidney section areas of PN25 kidney sections from Pkd1flox/flox:Pkhd1-Cre neonates treated as in (A). Shown is mean ± SEM of all sections quantified for each condition. **P < 0.01. (C and D) KW/BW ratios (C) and BUN levels (D) were decreased in PN25 Pkd1flox/flox:Pkhd1-Cre mice treated with JQ1 compared with that treated with DMSO (control). **P < 0.01. (E) qRT-PCR analysis mRNA level of c-Myc in kidneys from Pkd1flox/flox:Pkhd1-Cre mice treated with JQ1 or DMSO, respectively. c-Myc mRNA was decreased in kidneys of JQ1 treated Pkd1flox/flox:Pkhd1-Cre mice versus DMSO treated Pkd1flox/flox:Pkhd1-Cre mice. n = 3, *P < 0.05. (F) The expression of c-Myc protein was decreased and the expression of p21 was increased in kidneys of JQ1 treated Pkd1flox/flox:Pkhd1-Cre mice versus DMSO treated Pkd1flox/flox:Pkhd1-Cre mice. The expression of c-Myc and p21 was quantified by Image J and was presented as the relative expression level standardized to actin.

