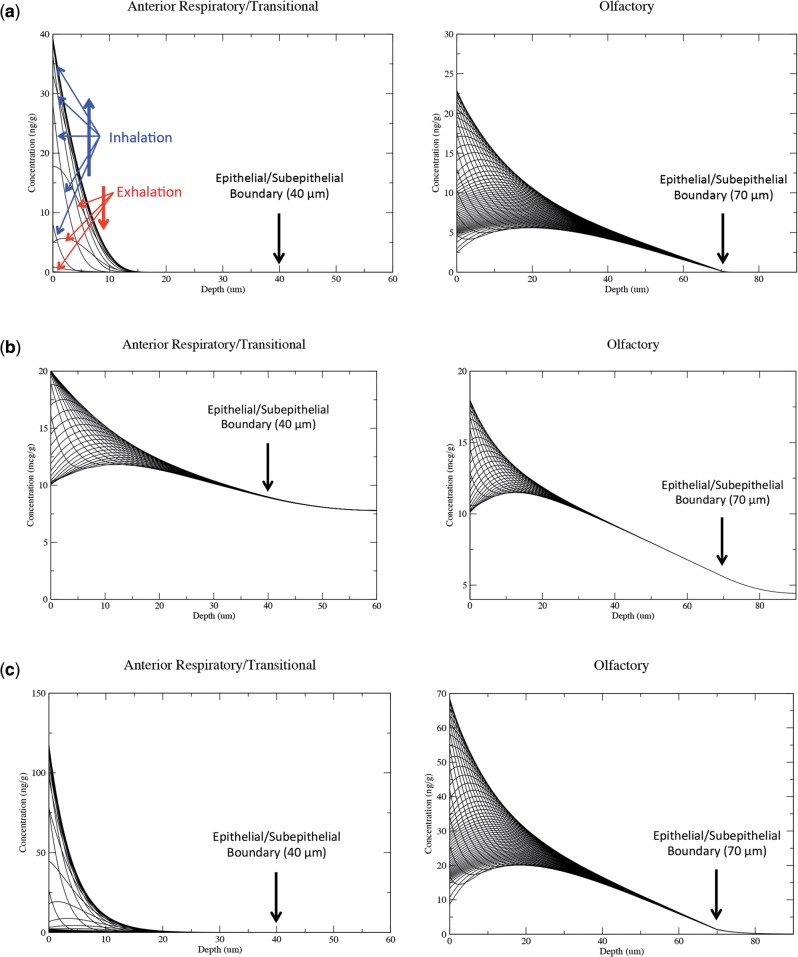
FIG. 6.
Tissue concentration profiles for the surface facet with the highest concentrations of (a) acrolein, (b) acetaldehyde, and (c) formaldehyde in rat target tissues (anterior respiratory/transitional region and olfactory region) as a function of penetration depth and time. Representative 0.01–0.03 s time series of each aldehyde concentration × depth profile is shown over the course of a full inhalation/exhalation cycle (see orientation arrows in the acrolein olfactory simulations). Exposure concentrations represented NOAEL’s for nasal lesions from subchronic inhalation studies (0.2, 50, and 1.0 ppm for acrolein, acetaldehyde, and formaldehyde, respectively). The breathing profile used in each CFD simulation is shown in Figure 2a and simulations were conducted until breath-by-breath steady-state concentrations were attained in all tissue compartments.

