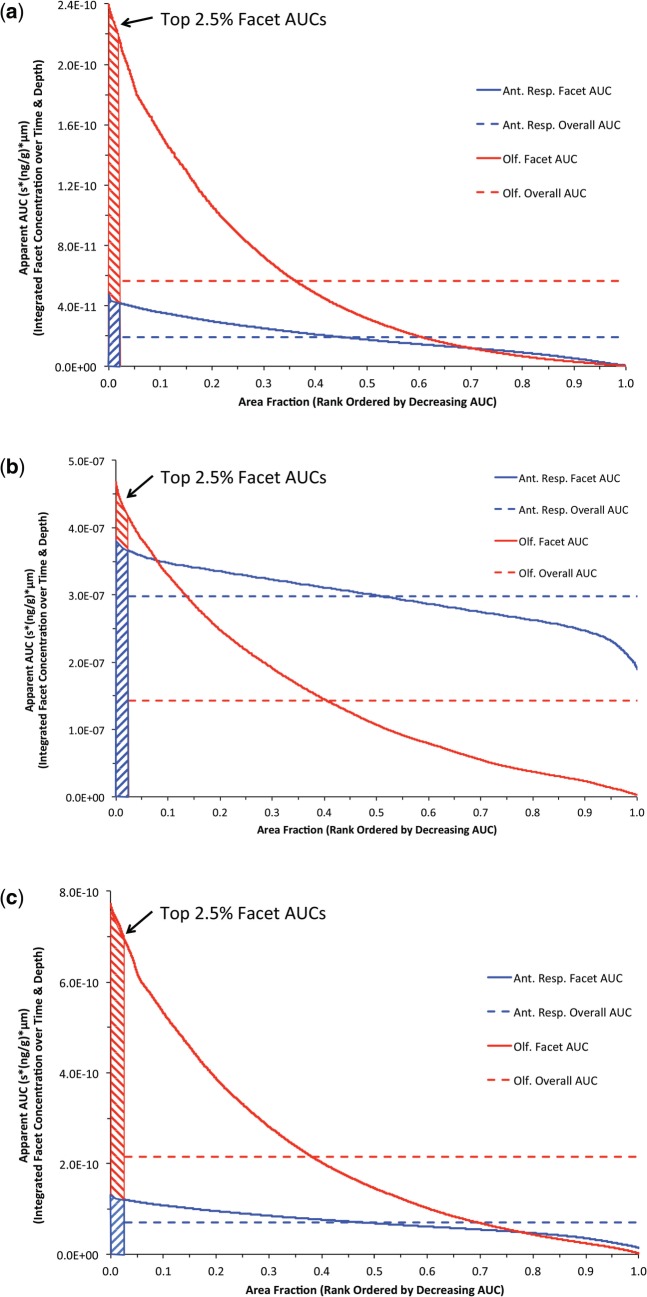
FIG. 7.
Rank ordered (descending) plot of aldehyde surface area normalized AUC tissue concentrations for each airway surface facet integrated over time and tissue depth in nasal airway target tissues of the rat (blue: anterior respiratory and transitional epithelium; red: olfactory epithelium) following NOAEL inhalation exposures to (a) 0.2 ppm acrolein, (b) 50 ppm acetaldehyde, and (c) 1 ppm formaldehyde using breathing patterns shown in Figure 2. The ‘hot-spots’ (shaded regions) were defined as the top 2.5% of AUCs for each airway compartment as described in the text. The overall compartment averaged AUC’s (dashed line) are shown for comparison.

