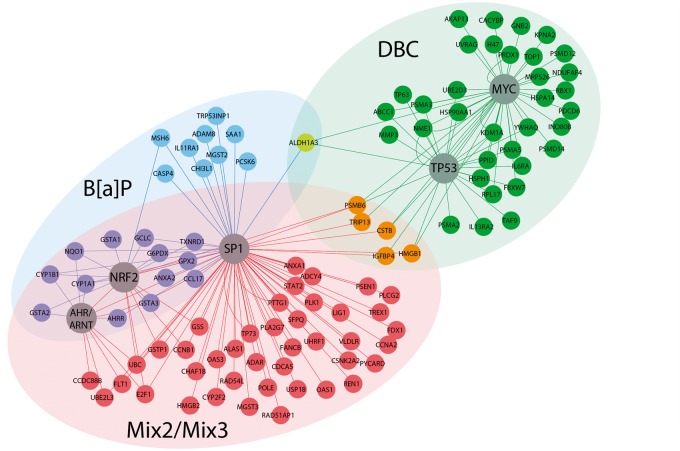
FIG. 5.
Network analysis of pathways predictive of PAH carcinogenic potential during initiation in mouse skin. Gene networks for predictive pathways are visualized for DBC (green), BaP (blue), and Mix2/3 (red). Transcription factors significantly overconnected (P < .05) by hypergeometric distribution to downstream gene expression networks were identified for each PAH treatment (Table 1) and are highlighted (circles) in the network figure. In particular, DBC displays unique gene expression and regulation compared with BaP and the PAH mixtures.

