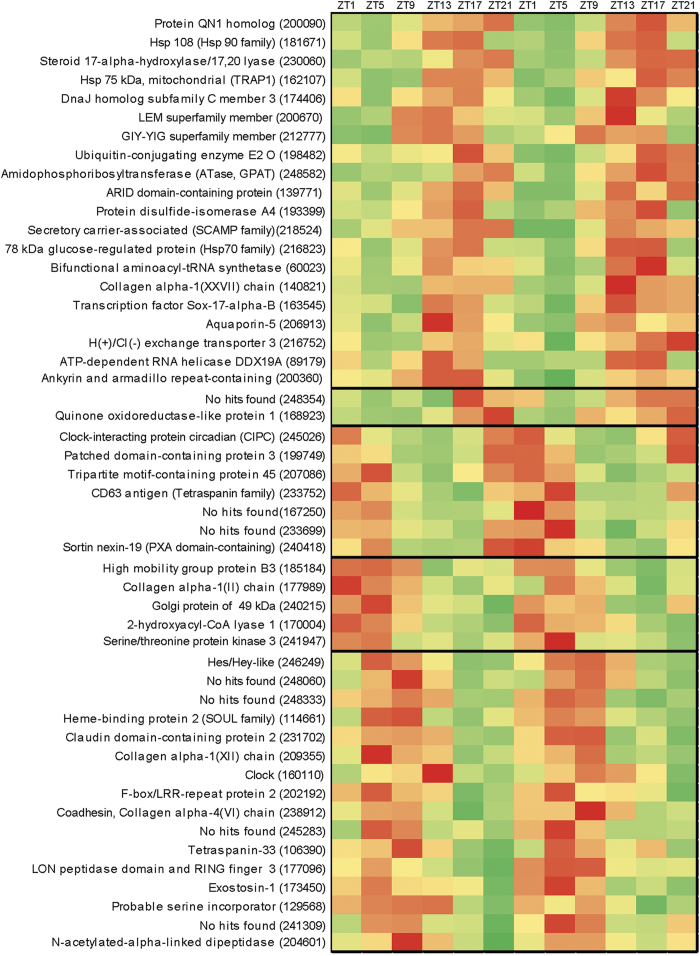
Figure 6. Heat map showing major expression of the 50 transcripts with strongest diel rhythmicity (highest g-factor) in Nematostella.
Provisional annotation was based on the top hit to the Swissprot database. Some gene names were edited based on phylogenetic analysis of the Nematostella genes, and some family or domain names were added parenthetically. See supplementary Table S1 for more complete annotation. Color scale ranges from red to green (highest to lowest relative expression). The x-axis indicates time of sampling, where Zeitgeber time (ZT) is the number of hours since the light cue was turned on (lights were turned on at 7 am and off at 7 pm; 8 am is ZT1). Heavy black lines within the heat map indicate genes with similar expression patterns, as identified through K-means clustering.

