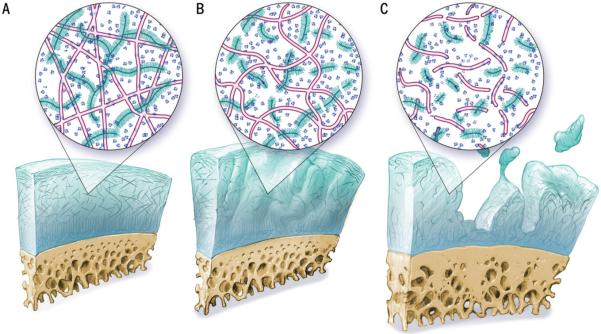
FIGURE 1.

Schematic showing changes in articular cartilage with osteoarthritis. Cartilage layer is shown in blue and subchondral bone in yellow. The zoomed area shows cartilage composition with pink collagen network and blue proteoglycan molecules. (A) Healthy cartilage, (B) early degeneration with intact cartilage but loss of proteoglycans and disruption of collagen network, and (C) advanced degeneration with cartilage fissuring, further loss of proteoglycans, and collagen degradation. ©Andrew Swift. Reproduced with permission.
