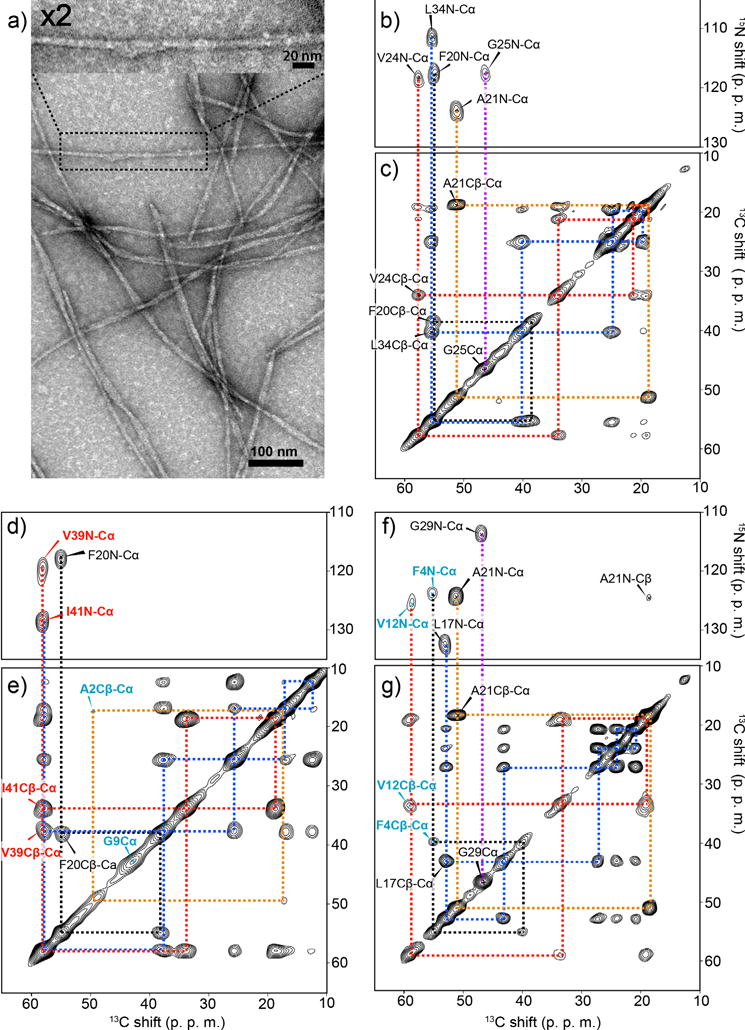
Figure 1.

Structural homogeneity and morphologies analysis of Aβ(1–42) amyloid fibril. (a) Transmission electron microscopy (TEM) images of seeded Aβ(1–42) fibrils. The sample was obtained 24 h after the 4th generation (G4) incubation of an Aβ(1–42) solution with seed Aβ(1–42) fibrils (5% in weight). (b, d, f) 2D 15N–13C correlation SSNMR spectra and (c, e, g) 2D SSNMR 13C–13C correlation spectra of seeded fibril samples labeled with uniformly 13C-, 15N-labeled at (b, c) Phe20, Ala21, Val24, Gly25, Leu34, (d, e) Ala2, Gly9, Phe20, Val39, Ile41, and (f, g) Phe4, Val12, Leu17, Ala21, Gly29. In (b, d, f) 2D DARR spectra with a mixing time of 50 ms present single intra-residue cross peaks for each 13C-13C pair, indicating a single conformer. The base contour levels were set to 4–6 times the root-mean-square (RMS) noise level. The contour levels in the 2D 13C–13C correlation spectra were set to (b) 5%, (d) 7%, and (f) 10% of the diagonal signals of (b, f) 13Cα of Ala21 or (d) Ile41.
