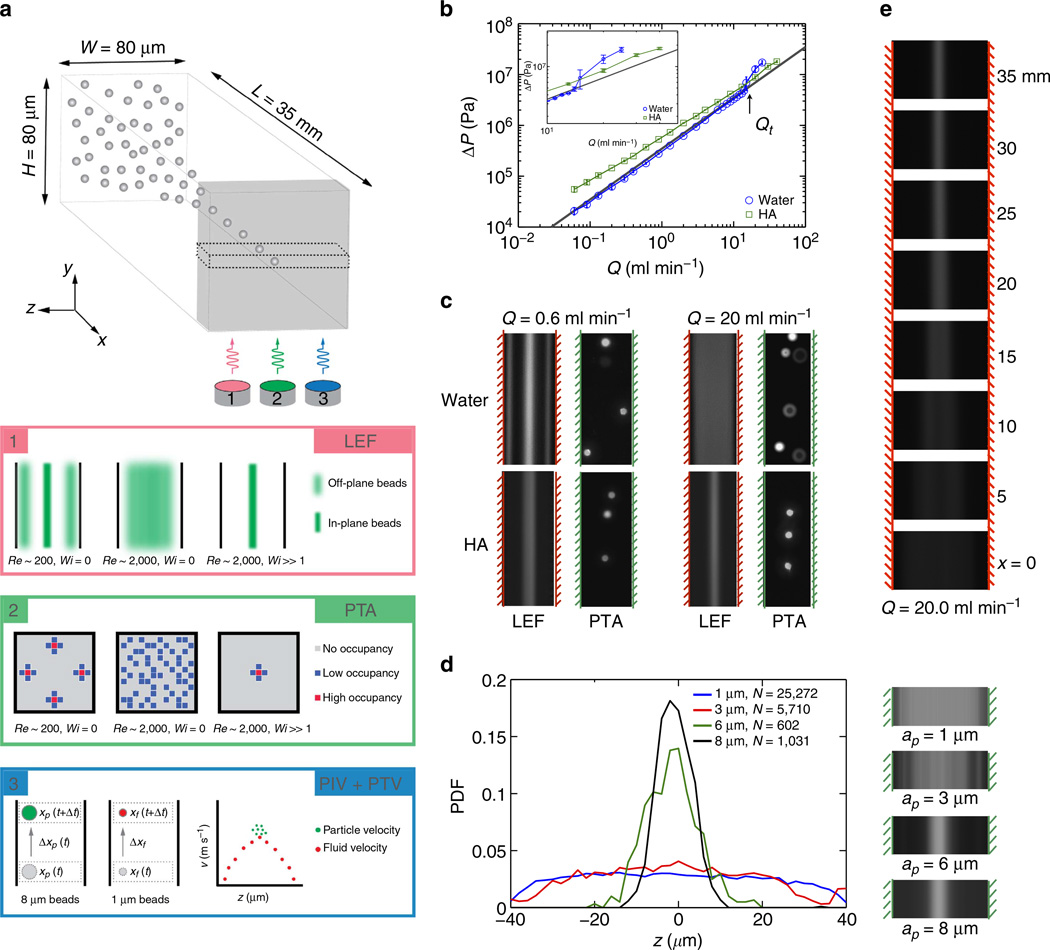
Figure 1. Particle focusing at high flow rates in water and HA solutions.
(a) Imaging techniques used to observe 8-µm particles (particle velocity and position) and 1-µm particles (fluid velocity). (b) Pressure drop across the fluidic system. The solid grey line indicates the expected pressure drop for the laminar flow of water in the microchannel. Inset plot shows pressure drops near the onset of inertially turbulent flow at Q = Qt. (c) LEF provides average particle distribution based on mean fluorescence intensity. Particle trajectory analysis provides two-dimensional particle histogram based on in-focus particles at a given imaging plane. The hashed lines indicate location of the rigid channel walls. A flow rate of Q = 0.6 ml min−1 corresponds to Re = 140 in water, and to Re = 105 and Wi = 17 in the viscoelastic HA solution. A flow rate of Q = 20.0 ml min−1, corresponds to Re = 4,630 in water and Re = 4,422 and Wi = 566 in HA. (d) Probability density function determined from N particles sized from ap = 1, 3, 6 and 8 µm (volume fraction ϕ = 2.0% for 1 µm and ϕ = 0.05% for 3, 6 and 8 µm) across the channel width determined from short-exposure images with pulsed laser illumination. The corresponding LEF images are shown adjacent to the plot. (e) LEF images of 8-µm particles at 5-mm intervals along the length of the channel at Q = 20 ml min−1, showing the lateral migration of the particles towards the centerline.

