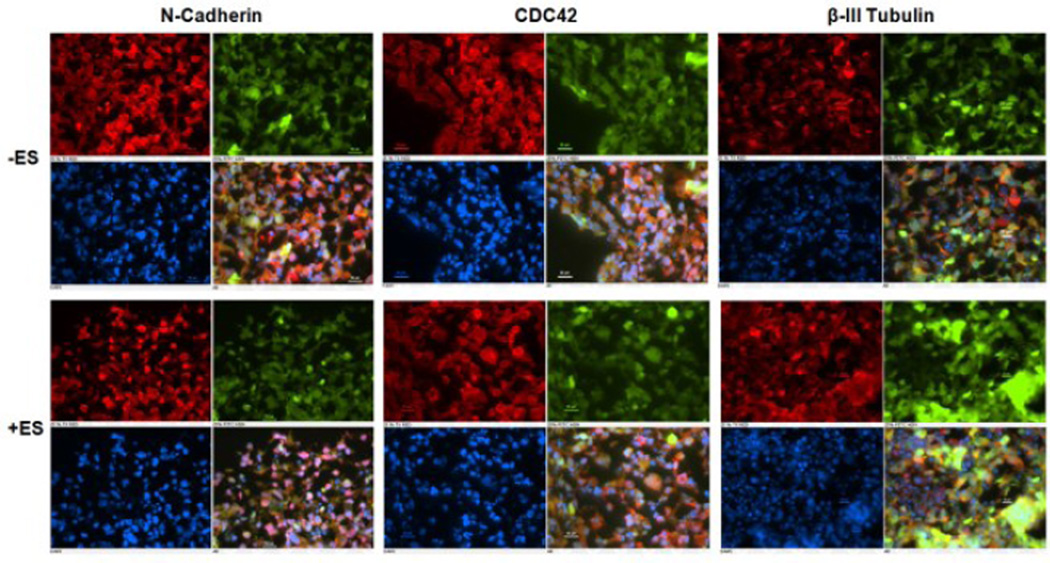
Figure 3.
Representative immunoflourescent images of relevant retinal proteins for control (−ES) and stimulated (+ES) samples. Images for NCadherin, CDC42, and ßIII-Tubulin are in the upper-left-hand position of each boxed set, GFP images are in the upper-right, DAPI nuclear stained images are in the lower-left, and composite images are in the lower-right, respectively. Scale bars correspond to 20 μm

