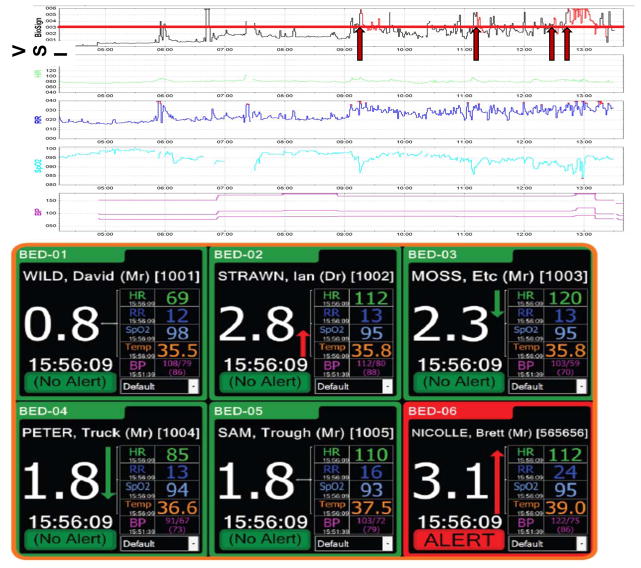
Figure 3. The Visensia Stability Index.
Top panel: The time series of a modified VSI (without temperature) utilized in one academic center is shown for one step-down unit patient, alongside the vital sign components of the VSI. A VSI of 3.2 (red line) was the cutoff value selected based on a training dataset of a similar patient population. If the VSI was consistently above this value, the alert would be triggered (red arrows) and would stay activated as long as the VSI stayed above 3.2 (red portions of VSI tracing). A medical emergency team (MET) was called to see this patient at 13:29; the VSI alert was triggered 4 times beforehand based often on subtle changes in one or more vital signs. (The first alert was over 4 hours prior to the MET activation.) Bottom panel: A monitor showing the VSI and its component vitals from multiple patients simultaneously. The monitor shows not only the current VSI value for a given patient, but the trend based on prior values. (Note that the cutoff value in this patient population was 3.0.) (Reprinted with permission from OBS Medical, Ltd.)

