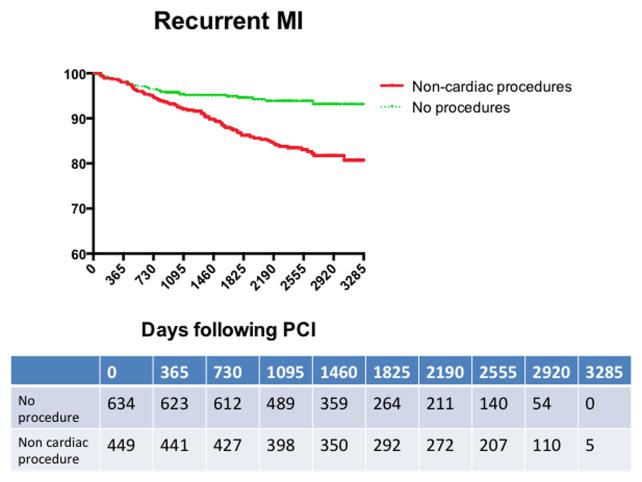
Figure 5. Kaplan-Meier curves demonstrating the event free survival from recurrent myocardial infarction throughout the follow up duration.
The overall rates of recurrent myocardial infarction were higher in patients who underwent non-cardiac procedures at the end of study follow-up. However, the curves did not start separating until after the first year after the index percutaneous coronary intervention. The numbers in the table represent the numbers still at risk for the endpoint at the indicated time points.

