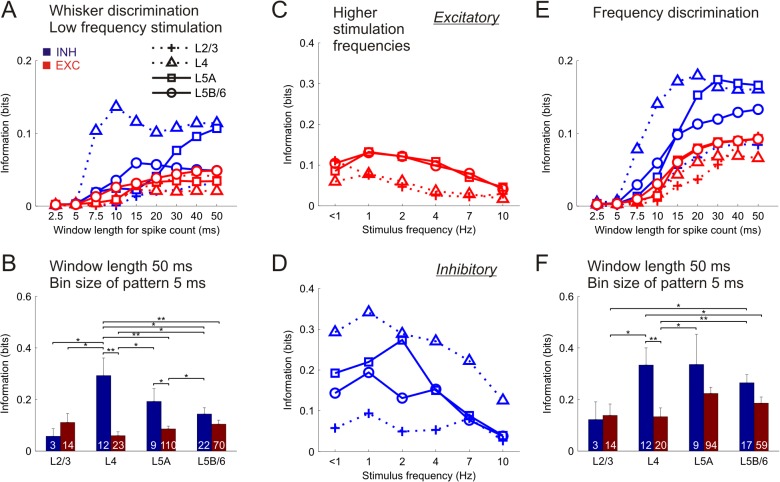
Fig 3. Distribution of stimulus information in single neurons.
(A) Time course of stimulus location information carried by the spikes counted in increasingly longer time windows for low frequency stimulation (<1 Hz). Data represent the mean values averaged across the specific neuronal subsets (symbols depicted at the legend, subset sizes displayed in panel B). (B) Stimulus location information using spike pattern parameters for optimal stimulus discrimination (see S2 and S5 Figs). Each bar represents mean±SEM values. Numbers inside bars represent amount of neurons in each subset. Otherwise same as in A. *P<0.05, **P<0.01. (C) Distribution of information at higher stimulation frequencies in different excitatory (EXC) cell groups (symbols represent layers as in A). Data represent the mean values of stimulus location information averaged across the tested stimulation frequencies. (D) Distribution of information in inhibitory (INH) cells (same as in C). (E) Time course of stimulus frequency information in INH and EXC cells (same as in A). (F) Stimulus frequency information using parameters for optimal discrimination (same as in B).

