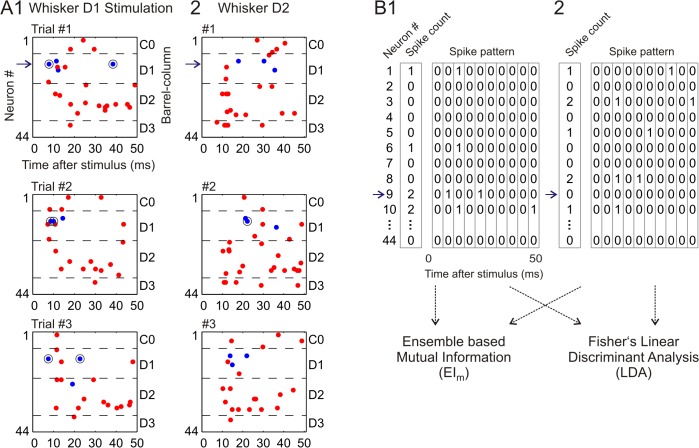
Fig 4. Representation of neural ensemble responses by spike count vectors and spike pattern arrays.
(A1) Neuronal ensemble activity in response to three trials of whisker D1 stimulation at low frequency. Blue and red dots mark the spike times of INH and EXC neurons, respectively. Cells were ordered along the y-axis according to their position on the shanks, i.e. belonging to the barrel-related columns C0 to D3 (see right side). The numbers at the left side (1 to 44) represent the ordering of the recorded neurons according to their horizontal location. Blue horizontal arrow (together with the black circle around its spike times) marks the INH neuron already presented in Figs 1 and 2A. (A2) Neuronal ensemble activity in response to three trials of whisker D2 stimulation (same as in A1). (B) Illustration of the method to quantify neural ensemble activity by spike count vectors and spike pattern arrays. Illustrative data are from trial #3 presented in panel A. In general, each trial is represented by a N neurons spike count vector, or a N neurons ⋅ N bins spike pattern array. Afterwards the spike count vectors and spike pattern arrays are used to compute (1) the ensemble-based mutual information, and (2) the decoding performance obtained using linear discriminant analysis classifiers (see text).

