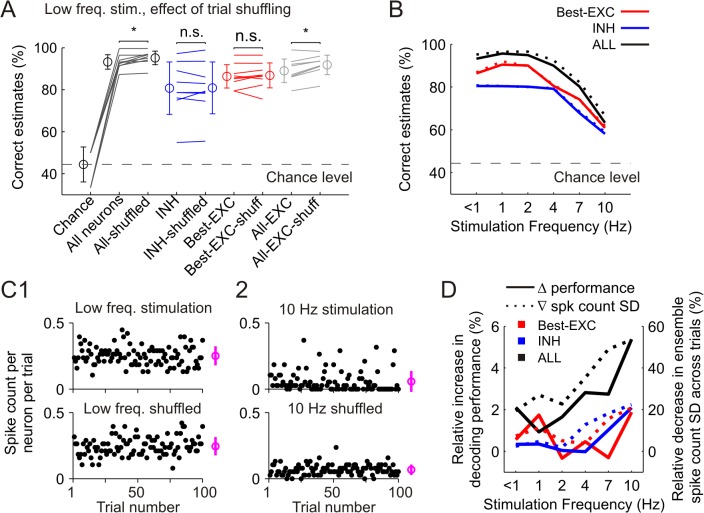
Fig 7. Performance of linear discriminant analysis (LDA) classifiers for decoding stimulus location at different frequencies.
(A) Impact of trial-shuffling on performance of the LDA classifiers at low frequency stimulation. From left to right, performance reached by networks containing the total amount of neurons in the recording (black), only INH neurons (blue), only the best EXC neurons (red), or all EXC neurons (grey). Circles and error bars denote mean±SD. Dashed line marks mean chance level averaged across all experiments (44.4%, n = 9). *P<0.05. (B) Decoding performance at higher stimulation frequencies using all neurons (black), only the INH ones (blue) or the best EXC ones (red). Continuous lines represent the mean decoding performance averaged across experiments. Thick dashed lines represent decoding performance after trial-shuffling. (C1) Upper part, progression of the ensemble activity during 100 trials of stimulation at low frequency in a representative experiment. Dots represent the number of spikes elicited per neuron (y-axis) in a specific trial (x-axis). Circle and bar at the right side represent mean±SD averaged across all trials. Lower part, surrogate data generated by trial-shuffling from the original activity presented in the upper part. (C2) Upper part, progression of the ensemble activity at 10 Hz whisker stimulation. Note that the first 20 trials (i.e. non-adapted) are omitted. Lower part, surrogate data generated by trial-shuffling. Note the more homogeneous distribution of the activity across trials. (D) Comparison of the relative increase in decoding performance obtained after trial-shuffling to the decrease in the variability of the ensemble activity level averaged across trials. Data are scattered across stimulation frequencies and neuronal groups.

