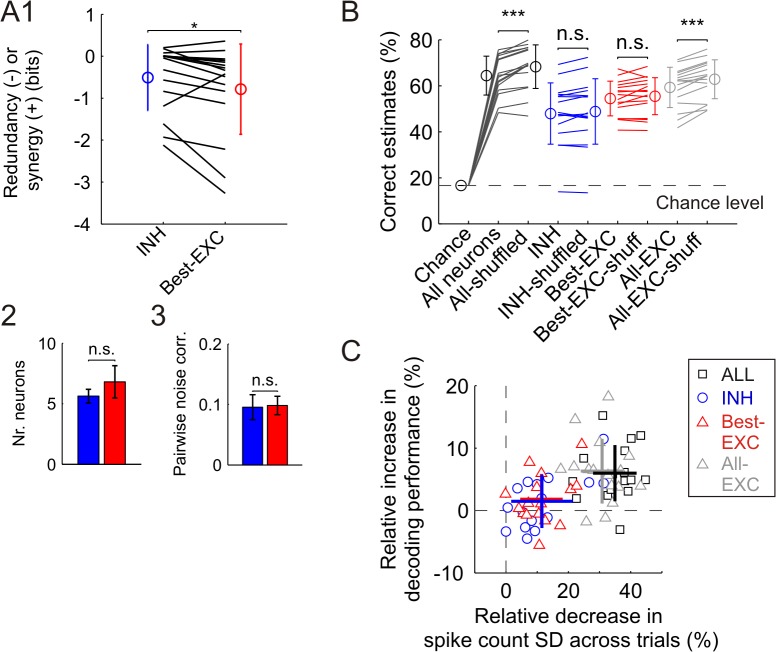
Fig 8. More efficient encoding of stimulus frequency by INH neuronal ensembles.
(A1) Comparison of information redundancy present in groups of INH neurons to that in equally informative groups of best EXC neurons. Each line represents the corresponding values of an individual dataset, including the stimulation blocks at all tested frequencies for a specific whisker and animal (n = 16 datasets from 8 animals). Circles and error bars denote mean±SD. *P<0.05. (A2) Number of neurons constituting the groups of INH and best EXC cells. Bars and error bars denote mean±SEM. (A3) Level of stimulus-independent noise correlations averaged across datasets. (B) Impact of trial-shuffling on decoding performance of the liner discriminant analysis decoders (same as in Fig 7A). ***P<0.001. (C) For each neuronal group, comparison of the relative increase obtained in decoding performance after trial-shuffling to the decrease in the variability of the ensemble activity level averaged across trials. Crosses represent mean±SD of the computed values for each neuronal group.

