
Fig 1. Fluorescence from EGFP in E. coli cell.
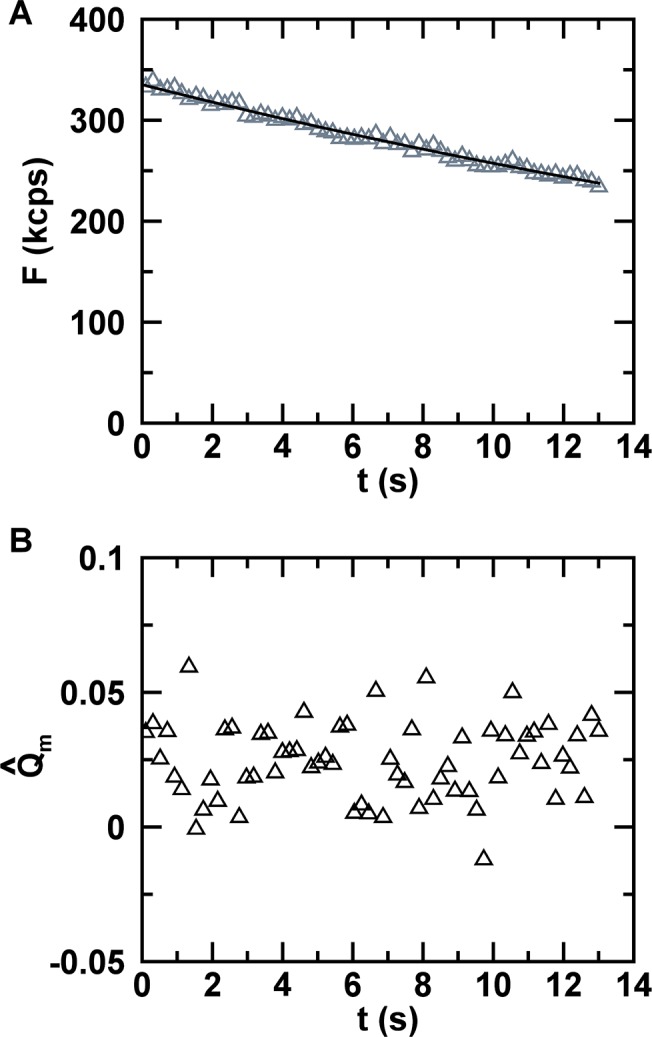
(A) Fluorescence intensity (triangles) decays with time as a result of photodepletion. The fit (solid line) to an exponential decay function recovered an initial intensity F 0 = 336 kcps and a depletion rate coefficient k D = 0.026 s-1. (B) Segmented Q-values for a segment time of T S = 0.2 s with an average value of 0.025.