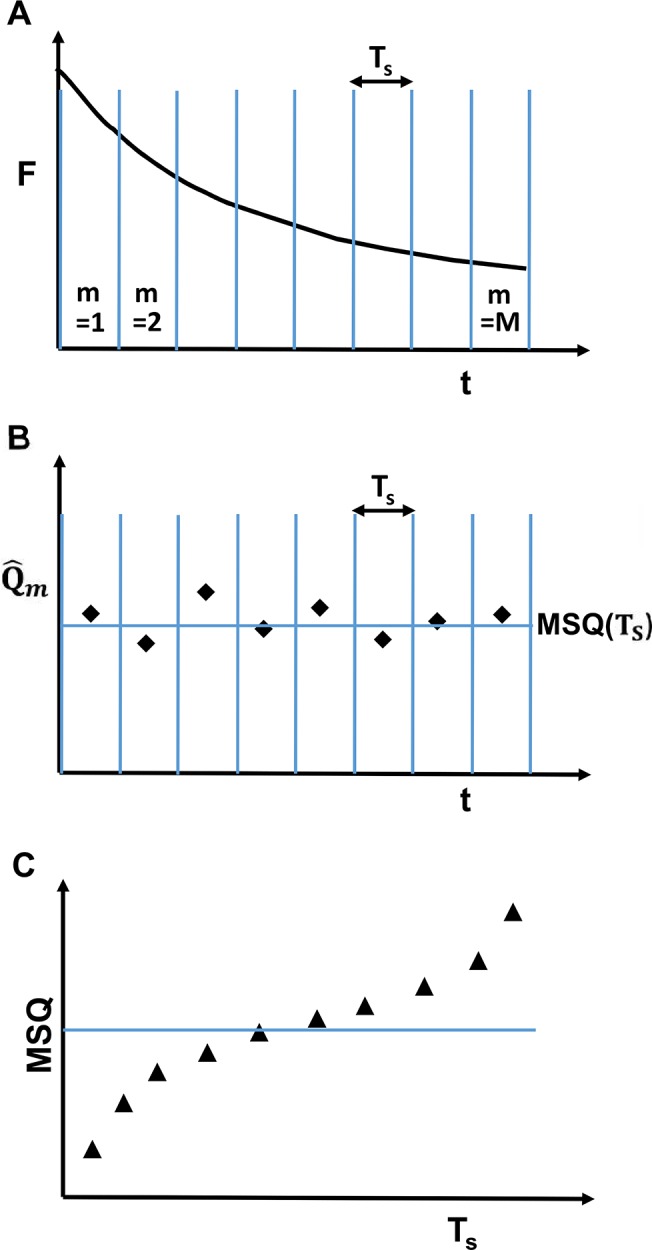
Fig 2. Schematic representation of MSQ analysis procedure.

(A) The decaying fluorescence intensity trace is divided into M segments. Each segment has a length of T S. (B) The Q-value is calculated from the photon count data of each segment, followed by the calculation of the mean of the segmented Q-values MSQ(T S). (C) The above steps are repeated for different segment lengths to calculate MSQ as a function of T S. Conventional FFS theory predicts that MSQ is independent of the segment length (solid line). The presence of photodepletion and estimator bias introduces curvature into the MSQ-curve (triangles).
