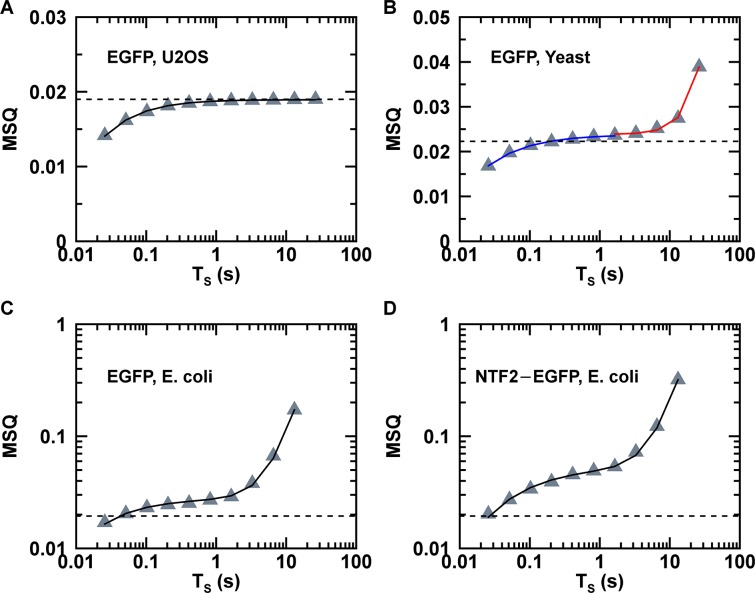
Fig 3. MSQ curves.
(A) MSQ-curve (triangles) for EGFP in U2OS cell and fit (solid line) to MSQ model with Q = 0.0193 and a diffusion time of 0.8 ms. (B) MSQ-curve (triangles) of EGFP in yeast cell. Fit (blue line) of data with T S < 1.6 s to Eq 8 yielded Q = 0.0237 and τ D = 1.2 ms. Fit (red line) of data with T S > 1.6 s to Eq 12 determined Q = 0.0238 and k D = 4.46 × 10⁻³ s-1. (C) MSQ-curve (triangles) of EGFP in E.coli cell and fit (solid line) to Eq 14 with Q = 0.028, τ D = 2.7 ms and k D = 2.7 × 10⁻² s-1. (D) MSQ-curve (triangles) of NTF2-EGFP in E.coli cell and fit (solid line) to Eq 14 with n = 2.1, τ D = 10 ms and k D = 5.3 × 10⁻² s-1. The dashed line in each panel represents the reference Q-value of EGFP in solution, which was measured at the same power as the corresponding MSQ data.

