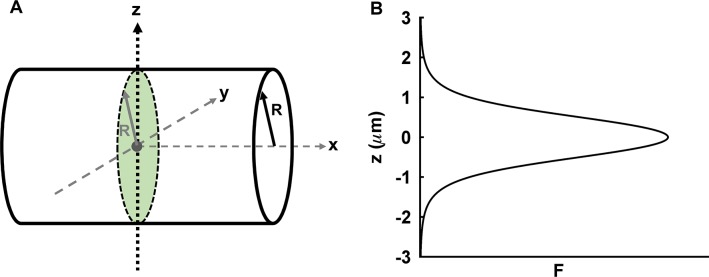
Fig 5. Schematic illustration of z-scan for E. coli experiments.

(A) Approximation of E. coli geometry by a cylinder with radius R. The scan axis z passes through the geometric center of the cylinder. (B) Z-scan fluorescence intensity profile of cylinder is modeled by Eq 18.
