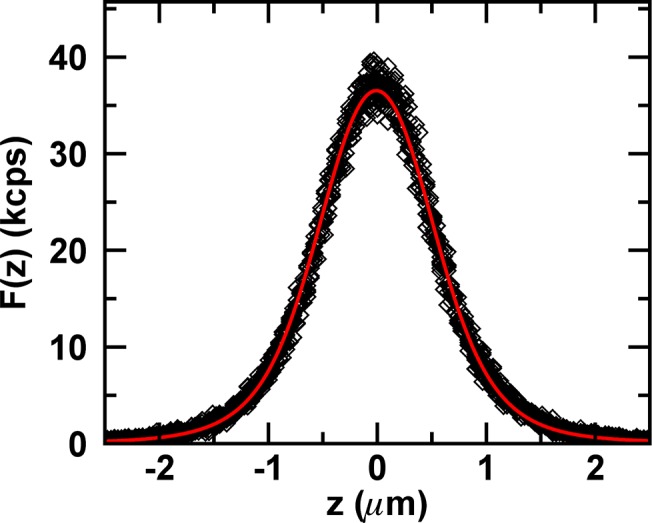
Fig 6. Experimental z-scan intensity profiles of EGFP from E. coli cell.

Experimental z-scan intensity data (diamonds) from eight consecutive z-scans together with model function (red curve) for F ∞= 72 kcps and R = 0.45 μm.

Experimental z-scan intensity data (diamonds) from eight consecutive z-scans together with model function (red curve) for F ∞= 72 kcps and R = 0.45 μm.