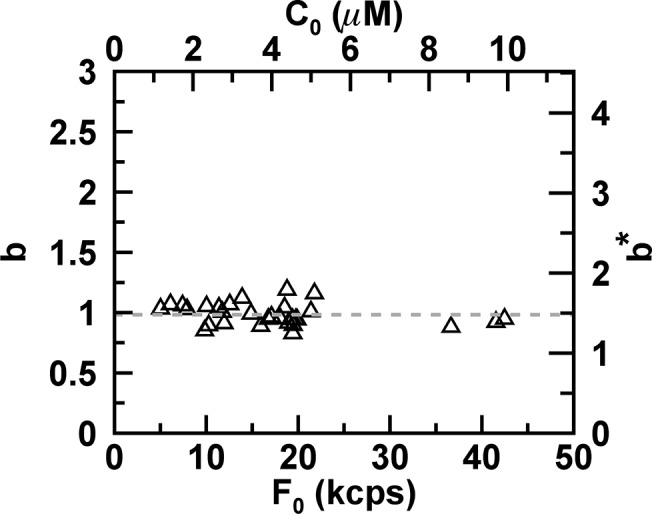
Fig 8. Normalized brightness of EGFP from E. coli cells.

MSQ-curves were fit to Eq 14 with A(Q 1, 1) = Q 1 and converted into a normalized brightness by b = Q 1/Q cyl,∞. The normalized brightness is independent of the initial fluorescence intensity F 0. The average brightness (dashed line) is 0.98 ± 0.09. The top axis represents the initial protein concentration, while the right axis displays the biased normalized brightness b * = Q 1/Q EGFP,∞, when the finite size of the bacterium is ignored.
