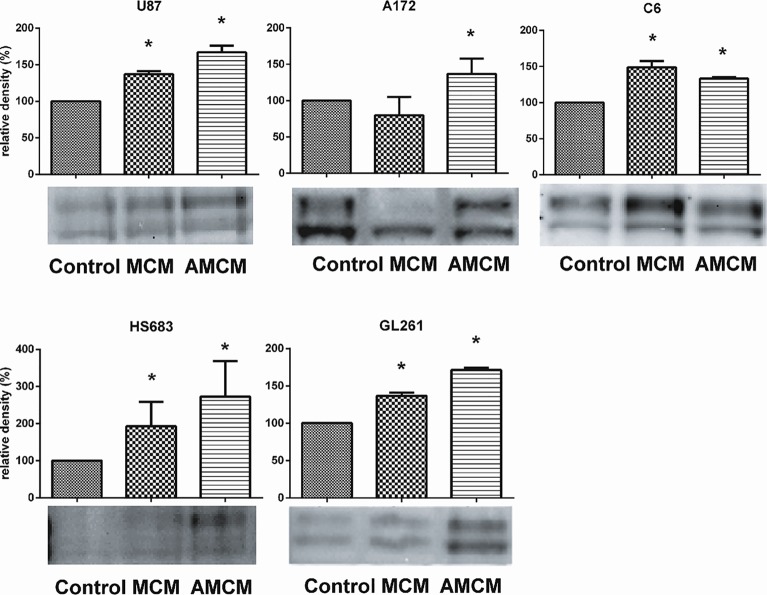
Fig 3. Factors released from microglia upregulate phosphorylation of Pyk2 in glioma cells.
Western blot analysis of pPyk2 (Tyr 579/580) protein in glioma cell lines. The signal is detected at the area corresponding to molecular weight of 116 kDa. The graph shows the density of protein in MCM and AMCM treatments relative to control. Two bands in pPyk2 (Tyr 579/580) detection identify phosphorylation in one or both sites. Intensity of the chemiluminescence signal was corrected for minor changes in protein content after densitometry analysis of the India ink stained membrane. The India Ink stained membranes are provided in S1 Fig. The “relative density” axis for HS683 cells is shown in a higher grid scale compare to other cell lines due to higher relative up regulation of Pyk2 phosphorylation in this cell line. Results are presented as mean ± S.D. with significant differences from control (*) (p < 0.05). One-way ANOVA followed by the Tukey’s multiple comparison test was used to determine significance between MCM or AMCM groups compared to control. 5 repeated experiments (N = 5) for each cell line were used for statistical analysis.

