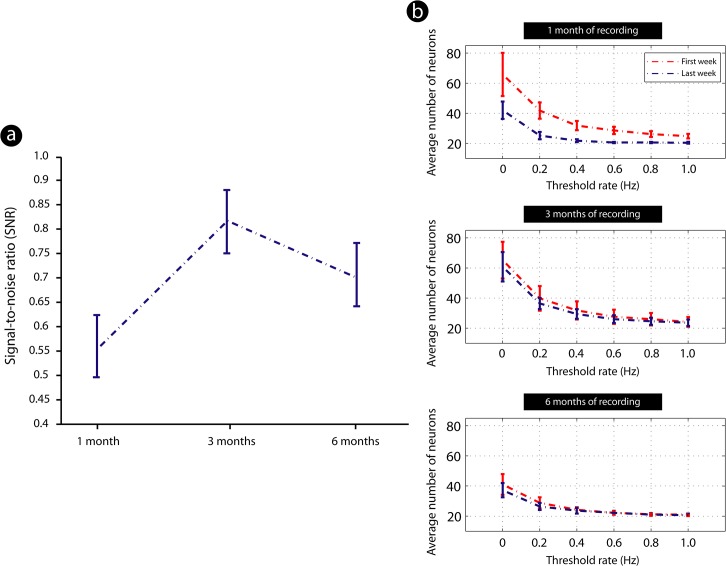
Fig 2. Signal-to-noise ratio (SNR) of cortical neurons recorded from all animals across distinct survival times.
(a). Measurement of the SNR average among all time points revealed an increase in this parameter after 3 months of implant as compared to 1 month of implantation. In latter survival time (6 months after the array implant), quality of recordings decreased as compared to previous time point, though a good SNR still had been identified (standard deviation threshold: SNR>std(SNR) = 1; and SNR<std(SNR) = 0) (n = 5 animals by time point); values expressed as mean ± SEM. (b). Temporal variation of the neuronal number in each group during its time of implant, comparing the first and the last week of array implantation in all survival times, in relationship to Threshold rate (Hz) adopted to assess SNR (see Material and Methods). There was an improvement in the number of neuronal units from 1 month to 3 months of implant. In latter survival time (6 months of implant) number of recorded cells decreased (n = 5 animals by time point).

