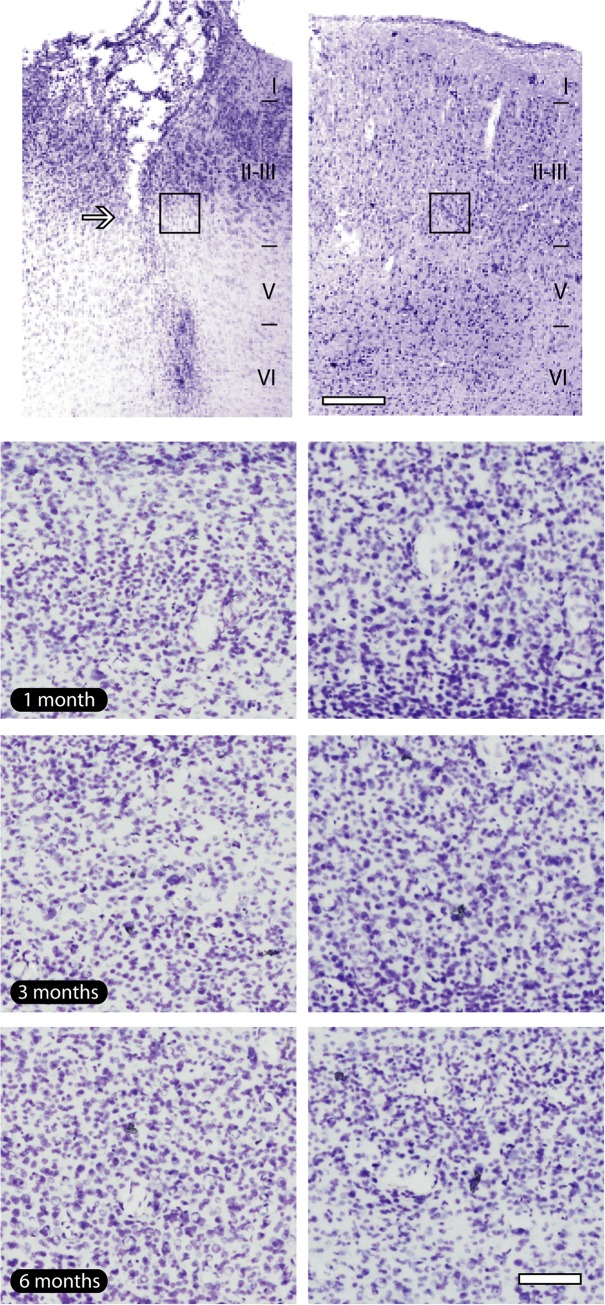
Fig 3. General pattern of implant sites.
(a). Nissl staining shows the well-defined location of the electrode track (arrow), revealing a small loss of tissue. (b). It was possible to attest the absence of vacuolization and pyctonic profiles in all time points evaluated. The tissue around electrode implants presented a similar aspect to their contralateral counterpart. Black squares in lower magnification pictures indicate the regions where enlargements were obtained in all groups. Left column of the figure: implanted hemisphere; right column of the figure: contralateral hemisphere, adopted as control. Scale bar: 100 μm (lower magnification); 200 μm (enlargements).

