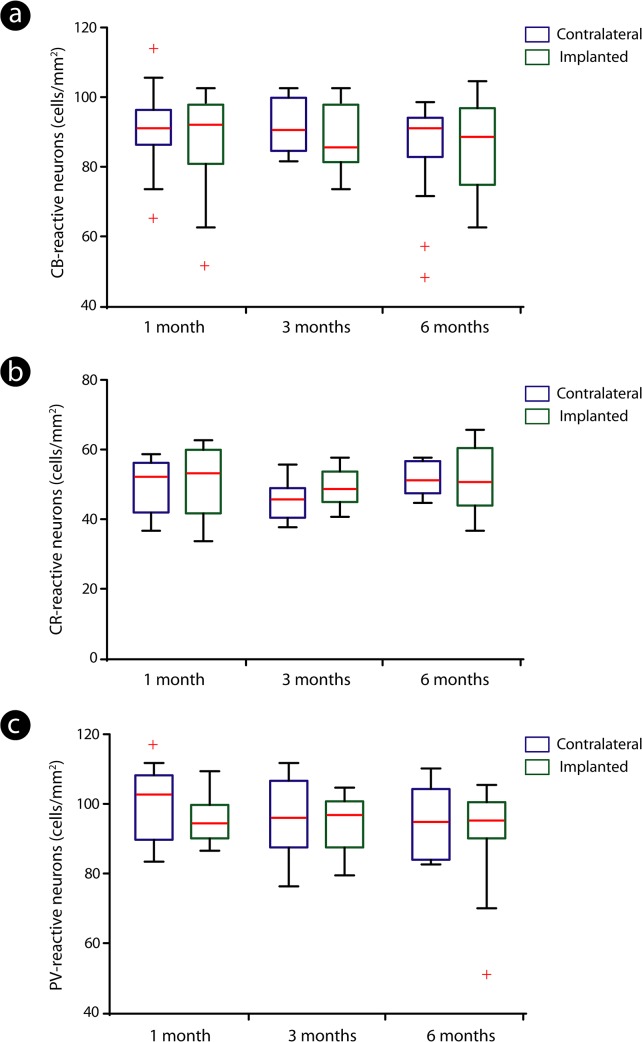
Fig 5. Distribution of calcium-binding proteins-reactive neurons across implanted and contralateral hemispheres.
Quantitative analysis revealed that the number of calbindin (CB)- (a), calretinin (CR)- (b) and parvalbumin (PV)-reactive neurons (c) did not differ significantly when implanted and contralateral sides were compared. Distinct colors (blue: contralateral hemisphere; green: implanted hemisphere) were adopted to provide a better identification of both control and implanted groups in all time points evaluated. The boxes correspond to the 25th and 75th percentiles (bottom and top of the boxes, respectively), the median values are indicated by the red horizontal line inside each box, the whiskers point out the minimum and maximum values and the crosses represent the outliers.

