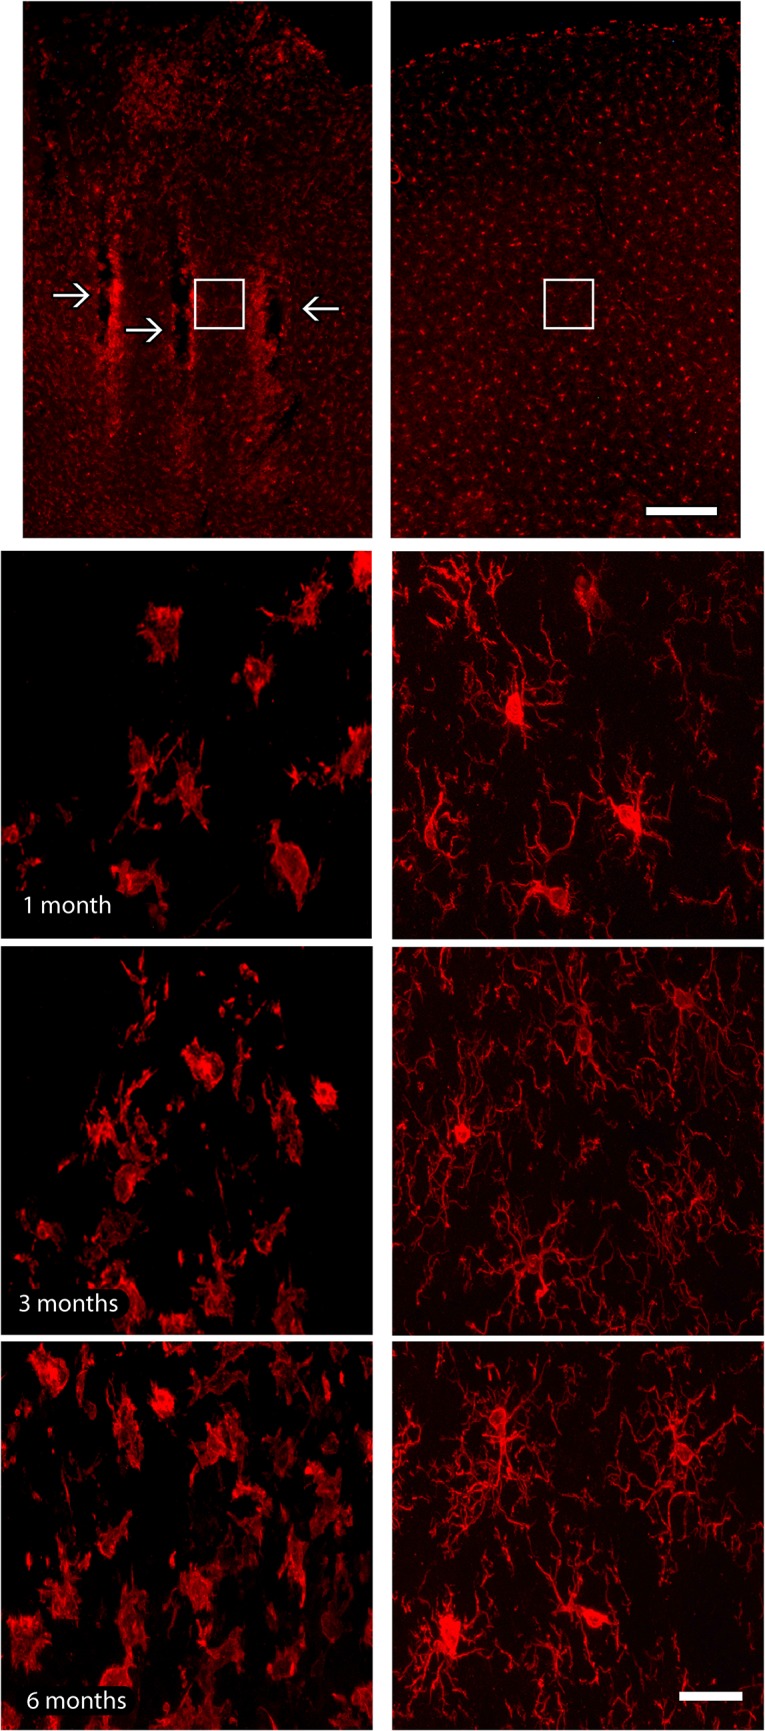
Fig 7. Microglial immunoreactivity across electrode tracks.

(a). Electrode implantation sites (arrows) were identified as a well-defined strip of microglial labeling, especially in latter survival time point. (b). Iba1-reactive microglial cells with a hypertrophic morphology were observed only in the vicinity of implants, whilst microglial cells presented a non-activated morphology in the contralateral hemisphere, possessing stellate non-hypertrophic cell bodies and thin and elongated processes. Activated microglial cells were not observed far from implant sites neither in contralateral hemispheres. White squares in lower magnification pictures indicate the regions where enlargements were obtained in all groups. Left column of the figure: implanted hemisphere; right column of the figure: contralateral hemisphere, adopted as control. Scale bar: 100 μm (lower magnification); 25 μm (enlargements).
