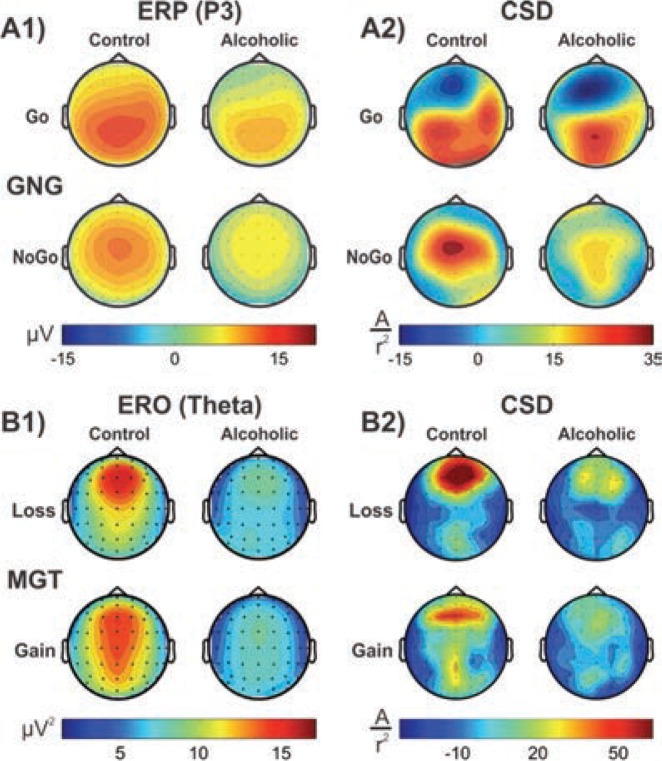
Figure 1.
The current source density (CSD) method provides measures of source activations, which are otherwise blurred in the scalp potentials. A1) P3 event-related potential (ERP) topography showing lower P3 amplitude (in microvolts) in alcoholics during both Go and No-Go conditions in a Go/No-Go task. A2) CSD maps (in ampere per squared radius) showing the Go condition with two bilateral sources in control subjects and only a midline source in alcoholics and illustrating the No-Go condition with a stronger, more focused source over the central region in control subjects and a weaker, more diffuse source over the central and posterior regions in alcoholics (Kamarajan et al. 2005a). B1) Topography of event-related oscillations (EROs) theta power (in microvolts squared) in alcoholics and control subjects during the loss condition in an monetary gambling tasks (MGT) task, plotted for ERO theta power during the N2-P3 complex (200 to 500 ms). B2) CSD maps of ERO theta activity showing a single and stronger midline prefrontal source during the loss condition in control subjects contrasted with bilateral and weaker prefrontal sources in alcoholics; during the gain condition, control subjects had well-defined anterior and posterior sources whereas alcoholics showed weaker and more diffuse sources (Kamarajan et al. 2012).

