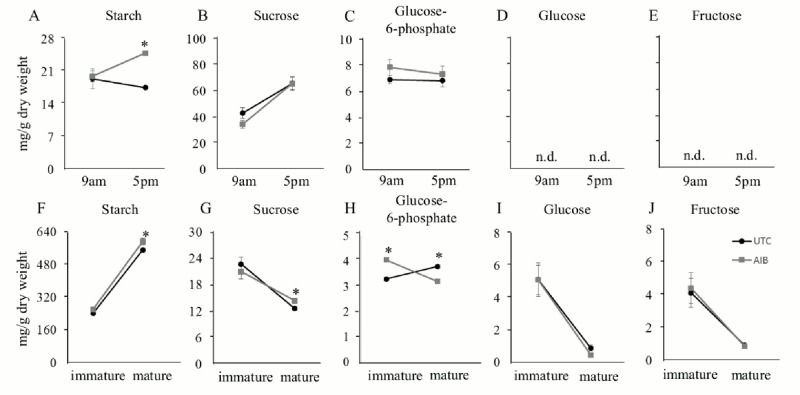
Fig 3. Starch and soluble sugars contents in source and sink tissues treated with Ethylene biosynthesis inhibitors.
Starch (A,F), Sucrose (B,G), Glucose-6-phosphate (C,H), Glucose (D,I), Fructose (E,J) contents in flag leaves (A-E) and immature/mature grains (F-J) treated with UTC and AIB at post-anthesis stage. Values are Mean ± SE (n = 4). * indicates significance at P ≤ 0.05; n.d. indicates not detected.

