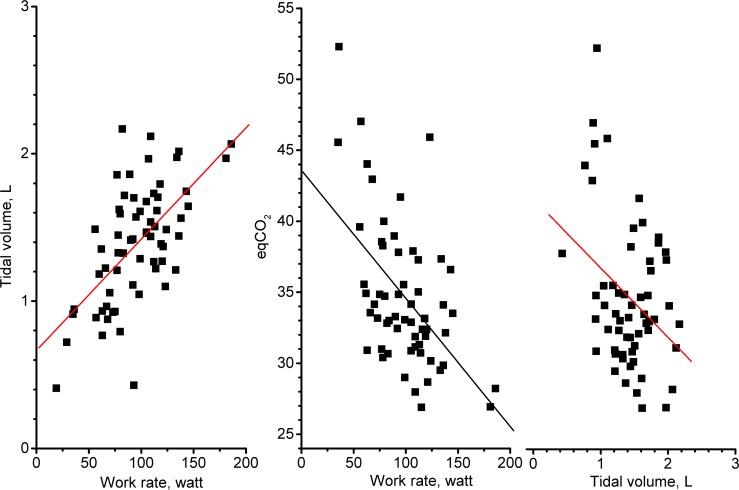
Fig 6. Relationship between tidal volume, ventilatory equivalent for CO2 output (eqCO2), and work rate at peak exercise.
Left panel: Relationship between tidal volume and work rate at peak exercise in all patients over the treatment period (r = 0.61, p < .0001); Middle panel: Relationship between eqCO2 and work rate at peak exercise in all patients over the treatment period (r = -.54, p < .0001); Right panel: Relationship between eqCO2 and tidal volume at peak exercise in all patients over the treatment period (r = -.35, p < .01).

